
Figure 2. PSMs elicit chemotaxis of DCs.
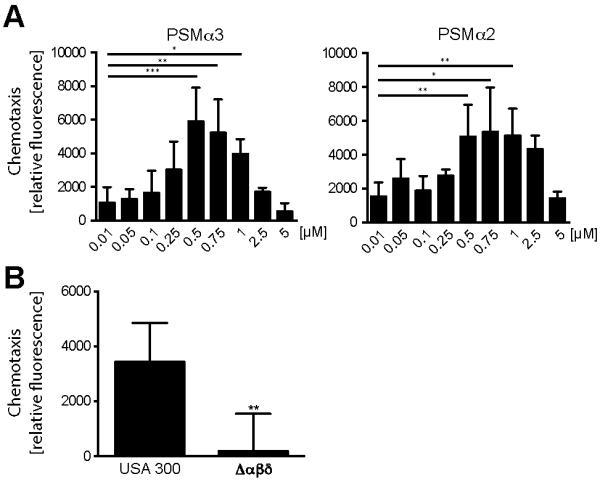
Chemotaxis of BM-DCs after treatment with the indicated concentrations of A PSMα3 (left graph) and PSMα2 (right graph) or B culture supernatants of USA300 and its deletion-mutant strain δαβδ for 100 min. Data represent means ± SD of three to four independent experiments done in duplicates. * indicates statistically significant differences (one-way ANOVA with Bonferroni post-test (A) or unpaired students t-test (B)).