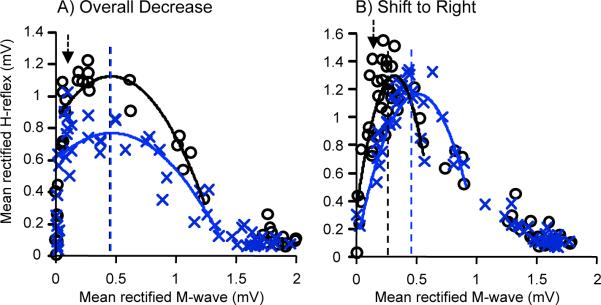
Figure 2.

Average H-reflex recruitment curves for the 6 baseline sessions (o) and the last 6 conditioning sessions (x) of 2 HRdown subjects. H-reflexes are plotted against the sizes of the accompanying M-waves. Second-order polynomial curves are fitted from the M-wave threshold to 50–70% Hmax of the down slope so that Hmax can be calculated for each curve (vertical lines). The arrow indicates the stimulus level used by the conditioning protocol (i.e., the M-wave size targeted by the protocol). In the subject in A (as in 3 of the 6 HRdown subjects), the recruitment curve is broad, the curve is depressed by conditioning, and the stimulus level that produces Hmax does not change. In contrast, in the subject in B (as in the other 3 of the 6 HRdown subjects). the curve is narrow, the stimulus level that produces Hmax rises, and the curve shifts to the right. In both subjects, the H-reflex produced by the stimulus level used in the conditioning protocol decreases.
