
Figure 1.
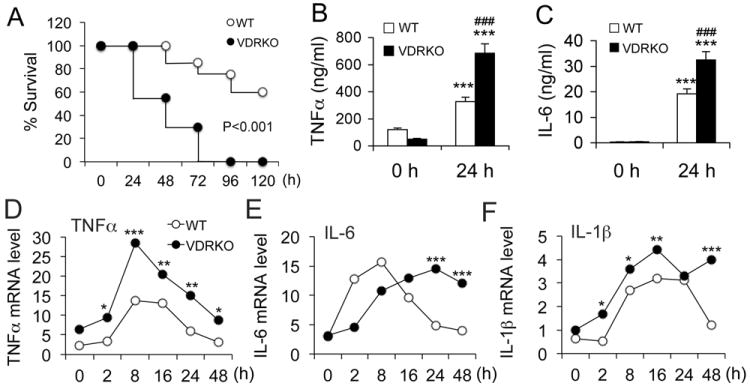
VDR inactivation leads to hyperresponsiveness to LPS. (A) Survival curves of wild-type (WT) and VDR-null (VDRKO) mice after intraperitoneal injection of LPS at 20 mg/kg; n=7-8. P<0.001 by logrank test. (B and C) Serum TNFα (B) and IL-6 (C) concentration in WT and VDRKO mice at 0 and 24 hours after LPS challenge. *** P<0.001 vs. 0 hour; ### P<0.001 vs. WT; n=7-8; (D-F) Time course of TNFα (D), IL-6 (E) or IL-1β (F) transcript induction following LPS (100 ng/ml) treatment in BMDMs derived from WT and VDRKO mice, n=3; * P<0.05, **P<0.01, *** P<0.001 vs. WT.