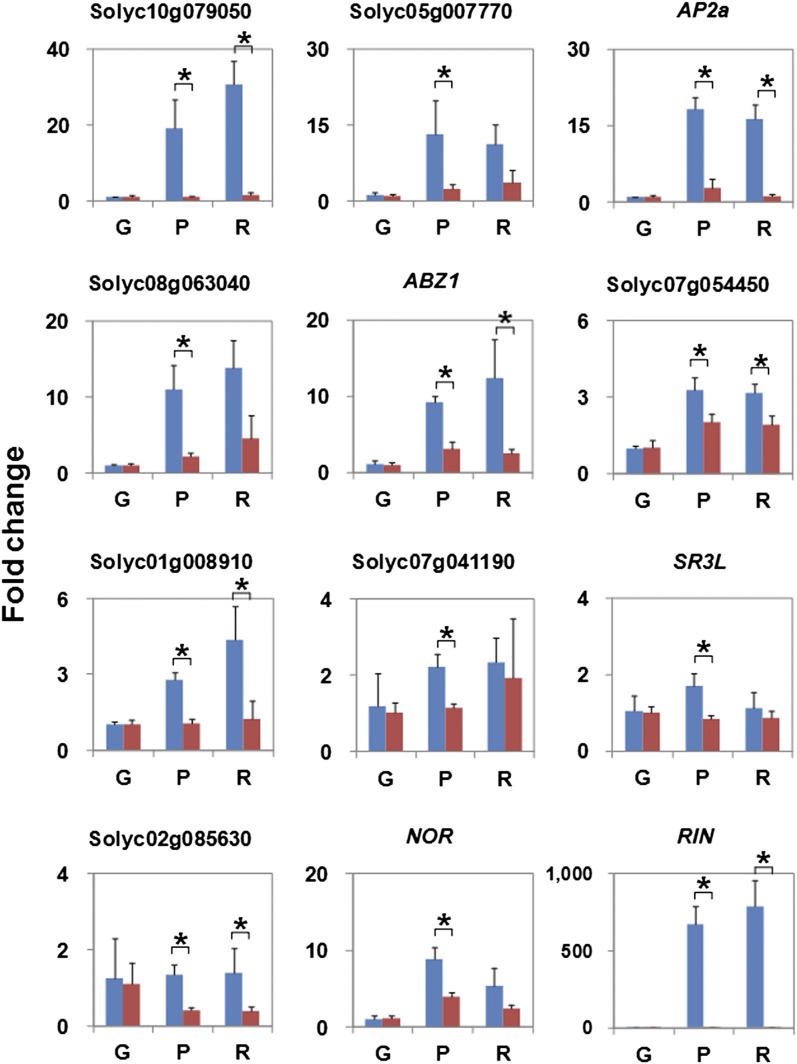
Figure 7.
Expression Targets during Ripening of Wild-Type and rin Mutant Fruits of TF Genes That Are Direct RIN Targets.
The change in expression level of the genes in the fruits at the ripening (P and R) stages is shown as FC relative to that in the G stage in the wild type and rin mutant. Bars represent the mean of three biological replicates. Error bars represent sd of the mean. Asterisks indicate a statistically significant (P < 0.05) difference in FC between the wild-type and rin mutant fruits at each P or R and G stage.

