Figure 8.
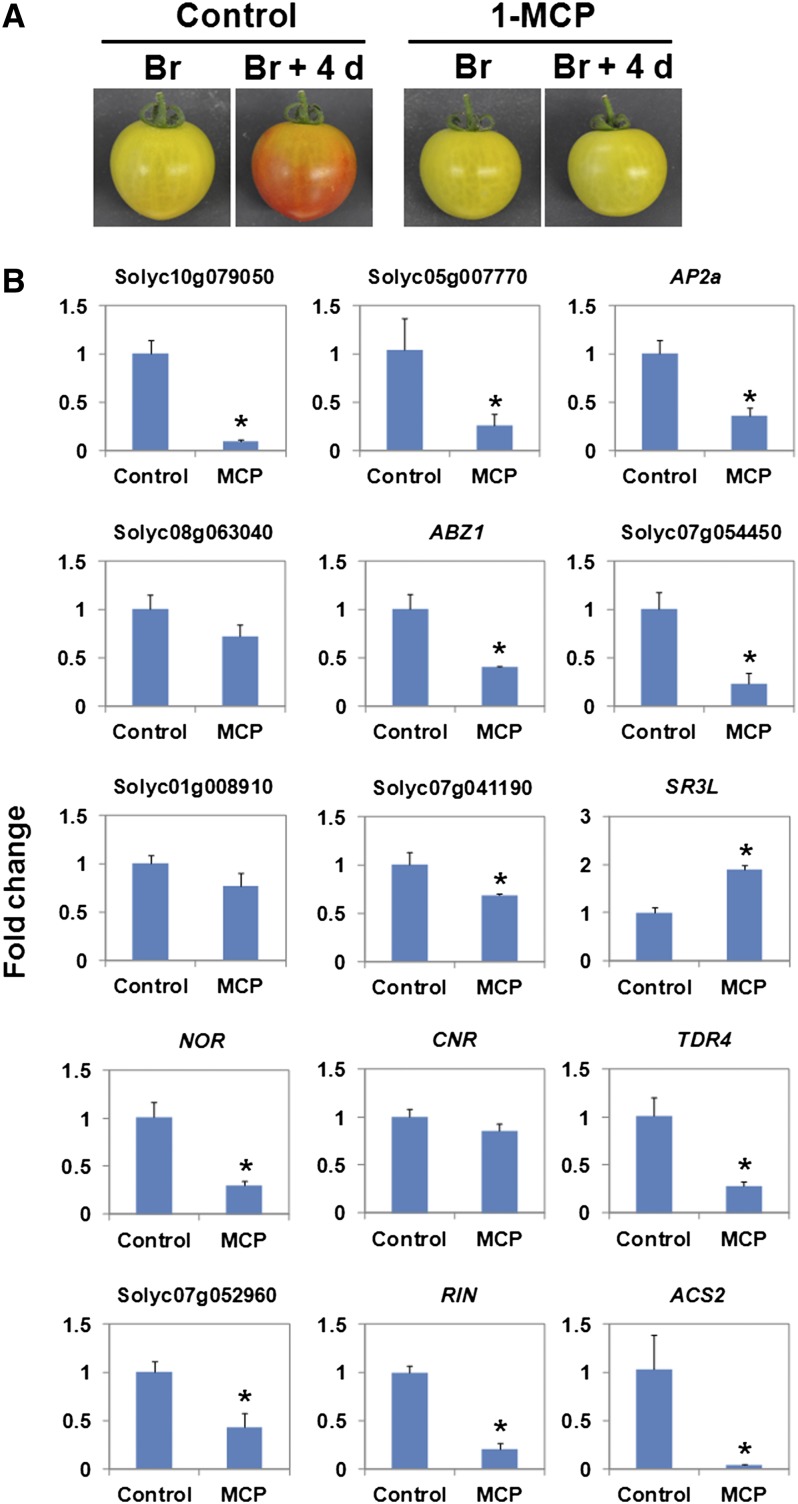
Expression of the TF Genes That Are Direct RIN Targets in Tomato Fruits Treated with 1-MCP.
(A) Tomato fruits at the breaker (Br) stage and after 4 d of treatment (Br + 4 d) with 1-MCP. Fruits harvested at the Br stage and treated with water for 4 d were used as a control.
(B) Expression analysis of direct RIN target TF genes in the control and 1-MCP–treated tomato fruits. The change in expression levels of the genes in the fruits treated with 1-MCP is shown as FC relative to the control. Bars represent the mean of three biological replicates. Error bars represent sd of the mean. Asterisks indicate a statistically significant (P < 0.05) difference in FC between the 1-MCP–treated fruits and control.

