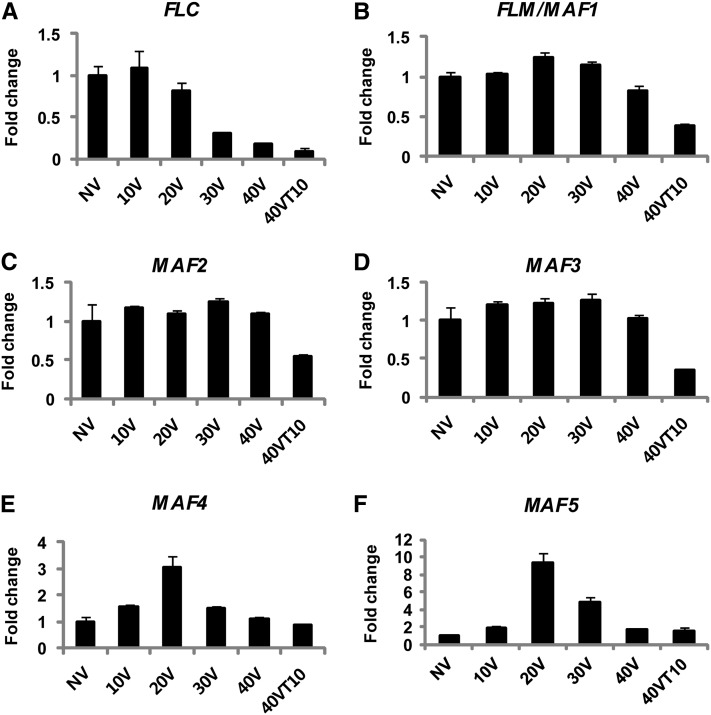
Figure 2.
Expression Analysis of FLC Gene Family Members during the Course of Vernalization.
mRNA expression analysis of FLC gene family members during the course of vernalization using real-time RT-PCR. NV, nonvernalized; 10V, 10 d of vernalization; 20V, 20 d of vernalization; 30V, 30 d of vernalization; 40V, 40 d of vernalization; 40VT10, 40 d of vernalization followed by 10 d of normal growth temperature. Relative fold change was determined by normalization with the levels of the PP2A gene. Real-time PCR experiments were performed with three biological replicates, and error bars indicate sd. Primer sequence information used for real-time RT-PCR analysis is shown in Supplemental Table 1 online.

