Figure 1.
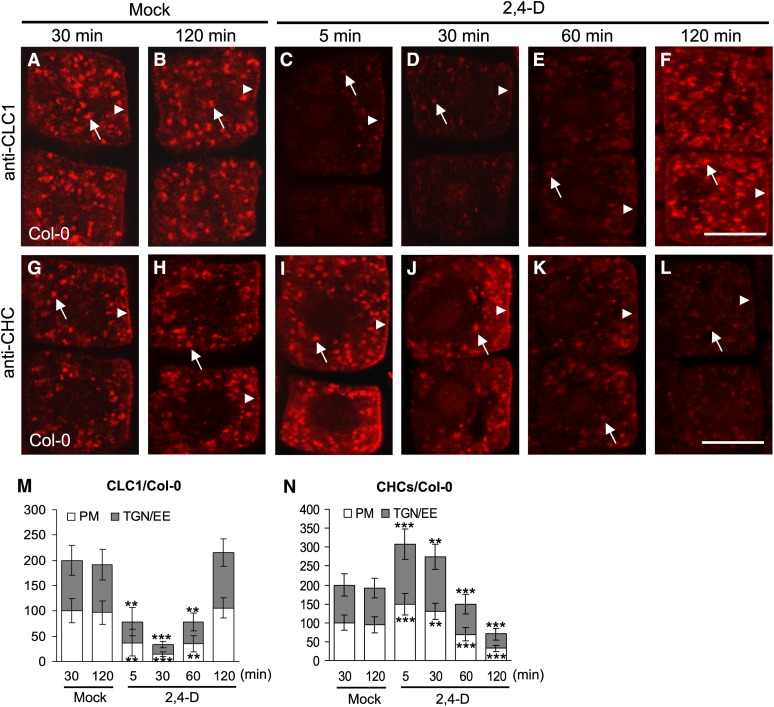
Kinetics of Auxin Effects on Membrane-Associated CLC1 and CHCs.
(A) to (F) Auxin effect on PM- and TGN/EE-associated CLC1 in the wild type.
(G) to (L) Auxin effect on PM- and TGN/EE-associated CHCs in the wild type.
(M) The relative intensity of CLC1 at the PM and TGN/EE ([A] to [F]).
(N) The relative intensity of CHCs at the PM and TGN/EE ([G] to [L]).
Different time lengths (5, 30, 60, and 120 min) after addition of 2,4-D (10 µM) or in the absence of exogenous auxin (mock controls) are indicated at the top of the figure. Arrows and arrowheads show TGN/EE- and PM-associated CLC1 or CHCs, respectively. Shown are means ± sd. Double and triple asterisks indicate P < 0.001 and 0.0001, respectively (Student’s t test). Bars = 10 µm.

