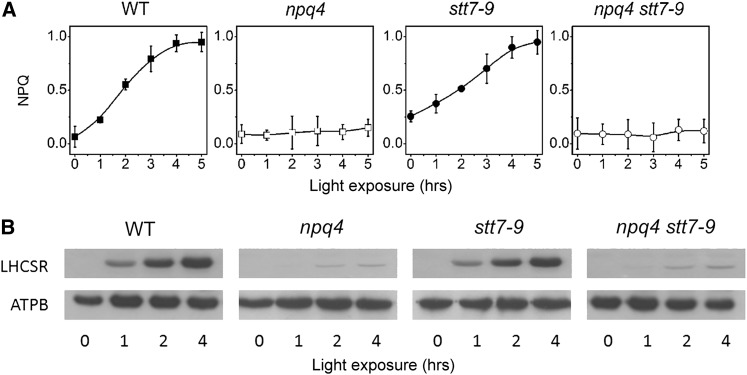
Figure 2.
NPQ Induction in Wild-Type, stt7-9, npq4, and npq4 stt7-9 Strains.
Cells were harvested in the exponential phase and resuspended in minimum HS medium at a concentration of 2 × 10⁷ cells mL−1. WT, the wild type.
(A) NPQ efficiency. Cells were exposed to high light (500 µmol photons m−2 s−1, white light) without external carbon dioxide addition for the indicated times and then briefly (10 min) dark adapted. NPQ capacity was evaluated from the (Fm − Fm′)/Fm′ parameter (Bilger and Björkman, 1990) using a fast imaging setup. Values represent mean ± se (n = 4 biological replicates).
(B) LHCSR accumulation. Cells were harvested at the indicated times, and samples were analyzed by immunoblotting with an anti-LHCSR antibody. ATPB (β-subunit of the CF0Fi ATPase) is shown as loading control. One microgram of chlorophyll was loaded in each lane.

