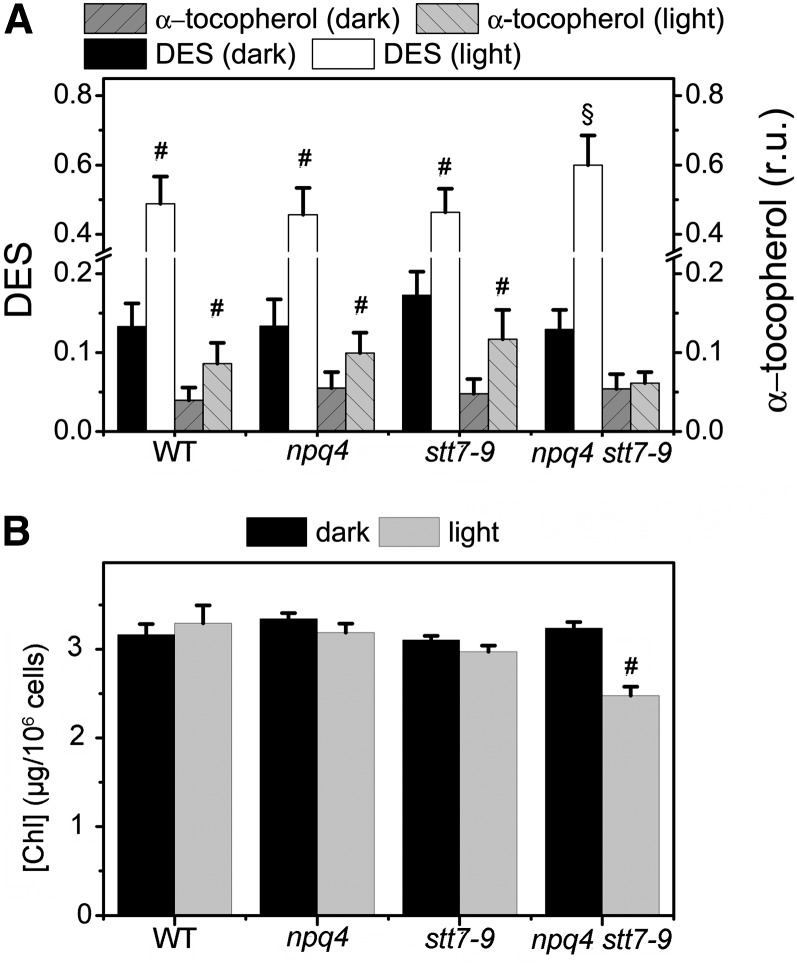
Figure 3.
Pigment Composition of the Different Strains in the Dark and after High-Light Exposure.
(A) Carotenoids and α-tocopherol content. C. reinhardtii cells were grown as described in Methods and harvested either in the dark or after high-light (500 µmol photos m−2 s−1, white light) exposure for 4 h. The cells were centrifuged and the pellet was resuspended in methanol. After three consecutive extractions, the supernatant was used to estimate pigment content by HPLC analysis. DES indicates the deepoxidation ratio ([zeaxanthin] + 1/2 [antheraxanthin])/([zeaxanthin] + [antheraxanthin] + [violaxanthin]). α-Tocopherol content is expressed as relative units (r.u.; after normalization to the lutein content). Values represent mean ± se (n = 3 biological replicates). WT, the wild type.
(B) Cellular chlorophyll (Chl) a+b content in dark and high light–treated cells. Values represent mean ± se (n = 4 to 6 biological replicates).
Statistical comparison was performed using one-way analysis of variance (ANOVA) followed by the Tukey multiple comparison test (P < 0.05). Symbols in the graph denote significant differences: #, between light and dark; §, from the wild type, npq4, and stt7-9.

