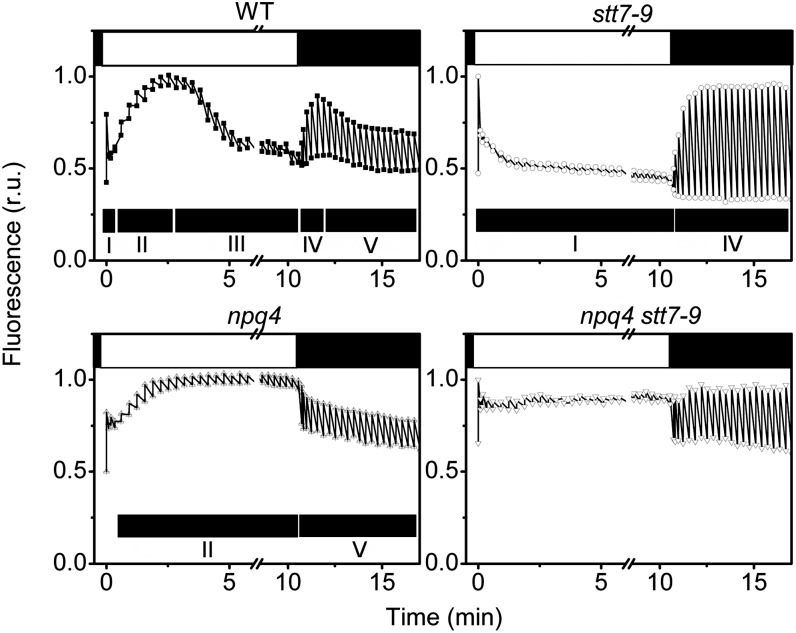
Figure 5.
Fluorescence Dynamics in High Light–Treated C. reinhardtii Cells.
Cells were harvested in the exponential phase and resuspended in minimum HS medium at a cell concentration of 2 × 10⁷ mL−1. They were exposed to high light (500 µmol of photons m−2 s−1, white light) for 4 h and then briefly (15 min) dark adapted before measuring their fluorescence dynamics upon exposure to actinic light (700 µmol photons m−2 s−1, λ = 520 nm). Closed box, dark; open box, actinic light on. Spikes represent maximum fluorescence emission achieved upon illumination with saturating pulses. Black bars indicate phases I through V. See text for more details. r.u., relative units; WT, the wild type.

