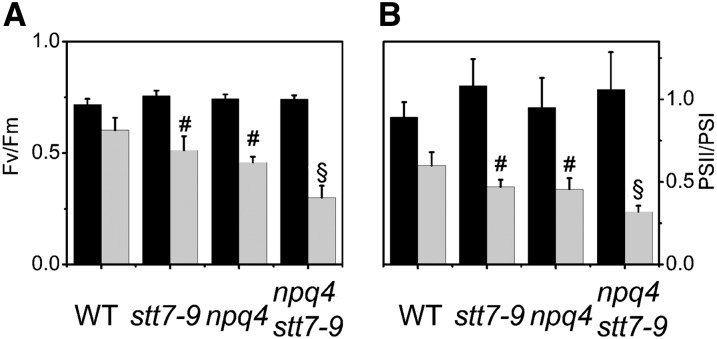
Figure 7.
PSI and PSII Activities in Wild-Type, npq4, stt7-9, and npq4 stt7-9 Cells.
Cells were harvested in the exponential phase and resuspended in minimum HS medium at a cell concentration of 2 × 10⁷ mL−1. WT, the wild type. Black columns, dark-adapted cells; gray columns, cells exposed to high light (500 µmol photons m−2 s−1, white light) for 4 h and then shortly (10 min) dark adapted. Values represent means ± se (n = 3 to 6 biological replicates). Statistical comparison was performed using one-way ANOVA followed by the Tukey multiple comparison test (P < 0.05). Symbols in the graph denote significant differences: #, from the wild type; §, from the wild type, npq4, and stt7-9.
(A) PSII efficiency. PSII quantum yield was monitored as Fv/Fm using an imaging fluorescence setup.
(B) Functional PSII:PSI ratio from the ECS signal. PSII and PSI activities were measured as described in Methods.

