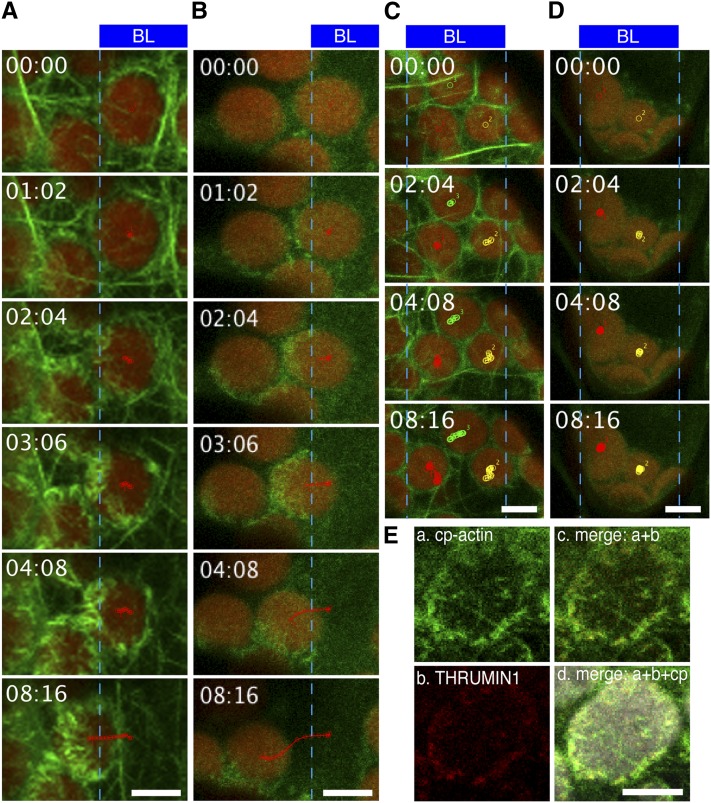
Figure 2.
Blue Light–Induced THRUMIN1 Association with Cp-Actin Filaments during the Chloroplast Avoidance Response.
(A) to (D) Serial images showing the chloroplast avoidance response induced by strong blue light (BL); the regions irradiated are indicated by the blue rectangles at the top part of the images. The images are false-colored to indicate GFP (green) and chlorophyll (red) fluorescence. The borders of irradiated and nonirradiated regions are shown with blue lines. Irradiation times (minutes:seconds) are shown at the top left corner. Selected tracks of moving chloroplasts are shown with red, green, or yellow lines. Reorganization of cp-actin filaments was visualized with GFP-TALIN in a wild-type cell (A) and a thrumin1 mutant cell (C), and with THRUMIN1-GFP in a wild-type cell (B) and a chup1 mutant cell (D). Note that cp-actin filaments are clearly visualized outside the irradiated region by both GFP-TALIN and THRUMIN1-GFP in wild-type cells but are not found or are very faint in both thrumin1 and chup1 mutant cells. See also Supplemental Movies 2 to 5 online for the full time-lapse series.
(E) Colocalization of cp-actin filaments visualized with GFP-TALIN and THRUMIN1-RFP. a, cp-actin filaments visualized with GFP-TALIN; b, THRUMIN1-RFP; c, merge of fluorescent images of GFP-TALIN and THRUMIN1-RFP; d, merge of fluorescent images of GFP-TALIN and THRUMIN1-RFP, and bright-field image of chloroplast (cp).
Bars = 5 µm.

