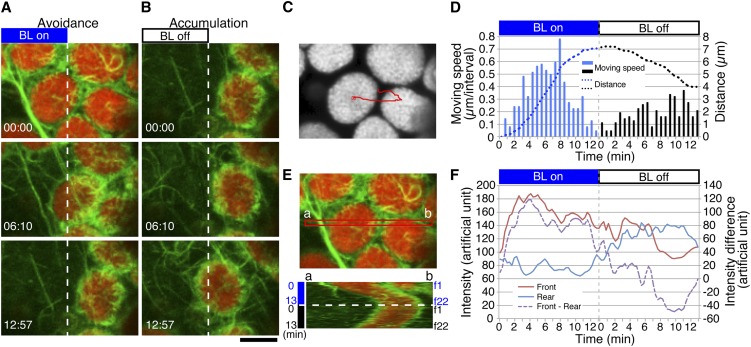
Figure 4.
Reorganization of Cp-Actin Filaments during the Strong Blue Light–Induced Avoidance Response Followed by the Dark-Induced Accumulation Response.
(A) Reorganization of cp-actin filaments during the avoidance response. The avoidance response was induced with 458-nm laser scans in the left half of the picture (BL on) during the intervals between the image acquisitions. Time-lapse images were collected at 37-s intervals for 12 min and 57 s. The images are false-colored to indicate GFP (green) and chlorophyll (red) fluorescence. The time points (minutes:seconds) at image acquisition are shown in the bottom left corner of the pictures.
(B) Reorganization of cp-actin filaments during the accumulation response. After switching off the blue light (BL off), an accumulation response toward the previously irradiated region occurred following the avoidance response (A). The other details are the same as in (A). Note that the cp-actin filaments are observed at both the front and rear parts of the moving chloroplast. See also Supplemental Movie 6 online for the full time-lapse series of (A) and (B). Bar = 5 µm.
(C) The path of a chloroplast that showed avoidance followed by an accumulation response ([A] and [B]). The center of the chloroplast was traced. The image for chlorophyll fluorescence shows the starting position before blue light irradiation.
(D) Movement speed and distance of the chloroplast shown in (A) to (C). The other details are the same as in Figure 1E.
(E) Kymograph analysis of the asymmetric cp-actin filaments on a moving chloroplast. The data at the red band (a and b in the top panel) were subjected to kymograph analysis (bottom panel). Frames 1 (f1) to f22 correspond to 0 to 15 min, respectively. The other details are the same as in Figure 1C. Note that the cp-actin filaments are observed only at the front side during the avoidance response but at both the front and rear sides during the accumulation response.
(F) Changes in total fluorescence of cp-actin filaments in the front (brown line) and rear (blue line) regions of the moving chloroplasts. The intensities of the GFP fluorescence were calculated from the kymograph in (E). The intensity difference between the front and rear regions is shown by the dotted purple line.

