Figure 6.
Reorganization of Cp-Actin Filaments Induced by Different Light Conditions.
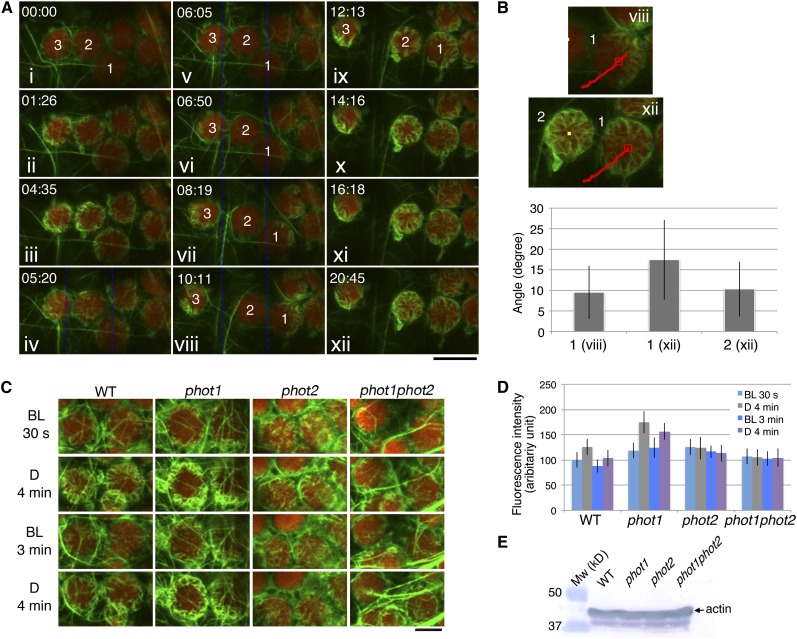
(A) Time-lapse images of the reorganization of cp-actin filaments under different light conditions. The 458-nm laser beam was used to scan the whole region shown here for 30 s before the first image was taken at 00:00 (i) for the depolymerization of all of the cp-actin filaments. The cells were then incubated in the dark until 04:35 (iii), except for a single image that was acquired at 01:26 (ii). The cp-actin filaments started to appear at the chloroplast periphery during the dark incubation. Subsequently, the region between the blue dotted lines was irradiated with a laser scan continuously until 10:11 (iv to viii). The chloroplasts on the left (3) and right (1) moved out of the beam with asymmetric cp-actin filaments, but the chloroplast (2) in the middle did not move, and its cp-actin filaments completely disappeared. After the laser beam was switched off at 10:11 (viii), the cp-actin filaments reappeared at the chloroplast periphery and extended toward the center of the chloroplast (ix to xii). The images are false-colored to indicate GFP (green) and chlorophyll (red) fluorescence. The time points (minutes:seconds) at image acquisition are shown in the top left corner of the pictures. Note that the cp-actin filaments at the far right of the chloroplast are not clear because of the different focal plane of the CLSM. Bar = 10 µm.
(B) Orientation of the cp-actin filaments on the chloroplasts that showed an avoidance response (1, viii of [A]) and on the dark-adapted chloroplasts (1 and 2, xii of [A]). The angles of the cp-actin filaments with respect to the center of the chloroplast were measured at different time points. The red lines in the images indicate the route that the chloroplast traveled. The number of cp-actin filaments that were measured was 9 for chloroplast 1 of viii, 14 for chloroplast 1 of xii, and 15 for chloroplast 2 of xii. The data are presented as mean ± sd.
(C) Phototropin-dependent cp-actin filament dynamics. Cells of wild-type, phot1, phot2, and phot1 phot2 mutant leaves were irradiated with serial scans of a 458-nm laser for 30 s (BL, 30 s) and then incubated in the dark for 4 min (D, 4 min). Next, serial scans with 458- and 488-nm lasers for 3 min (BL, 3 min) were employed to induce the disappearance of the cp-actin filaments (see also the full time-lapse series in Supplemental Movie 9 online). Finally, the cells were incubated in the dark for 4 min (D, 4 min). The images are false-colored to indicate GFP (green) and chlorophyll (red) fluorescence. Note that the cp-actin filaments disappeared following the laser scan but appeared in the dark in both the wild type and the phot1 mutant but not in the phot2 and phot1 phot2 double mutant cells. Bar = 5 µm.
(D) Quantitative analysis of phototropin-dependent cp-actin filament dynamics. The fluorescence intensities of cp-actin filaments were measured in the wild-type, phot1, phot2, and phot1 phot2 mutant cells, representing the changes in the total fluorescence of cp-actin filaments shown in (C). The average fluorescence intensities of GFP-TALIN were obtained from different squares (1.6 × 1.6 µm) from five individual chloroplast edges. The data are presented as mean ± sd (n = 20 squares).
(E) Immunoblot analysis of the endogenous actin levels in the rosette leaves of the wild-type, phot1, phot2, and phot1 phot2 plants. Fifty micrograms of total protein was separated on a 10% SDS-PAGE gel and immunoblotted with an anti-actin monoclonal antibody (see Methods for details).

