Figure 1.
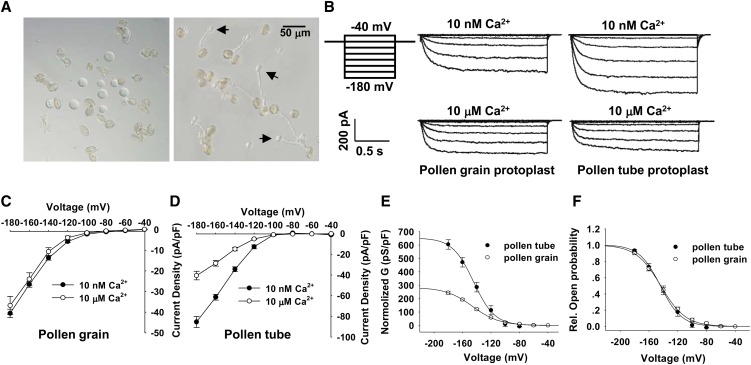
Ca2+ Sensitivity of the K+in Currents Recorded from Arabidopsis Pollen Grain Protoplasts and Pollen Tube Protoplasts.
(A) Photographs of pollen grain protoplast (left) and pollen tube protoplast (right) isolation. Pollen tube protoplasts emerging from pollen tubes during the enzymatic digestion are indicated with arrows.
(B) Typical K+in currents recorded from pollen grain protoplasts (middle column) and pollen tube protoplasts (right column) with the addition of 10 nM or 10 μM free Ca2+ in the pipette solution. Voltage protocols, current, and time scale bars are shown in the left column.
(C) and (D) Current-voltage relationship of the K+in currents recorded from pollen grain protoplasts (C) and pollen tube protoplasts (D) with the addition of 10 nM or 10 μM free Ca2+ in the pipette solution. The data are derived from the recordings as shown in (B) and are presented as means ± se (n ≥ 8). The replicates for each treatment shown in (C) are 14 (10 nM Ca2+) and 8 (10 μM Ca2+), and the replicates for each treatment shown in (D) are 16 (10 nM Ca2+) and 13 (10 μM Ca2+).
(E) The G-V relationship of the steady state currents recorded from pollen grain protoplasts and pollen tube protoplasts. The G was normalized and calculated as normalized G = G/Cm, where Cm is the membrane capacitance of the protoplast. The data are presented as means ± se (n ≥ 6). G-V curves were best fitted with the Boltzmann function.
(F) The relative open probability (G/Gmax) of K+in channels in pollen grains and pollen tubes plotted against the test voltage. The solid lines represent the best fits according to the Boltzmann function: G/Gmax = 1/(1+exp((Vm − V1/2)/S)). G is the cord conductance and calculated as G = I/(Vm − EK). S is a slope factor equivalent to RT/zF, where z represents the apparent gating charge. The data are presented as means ± se (n ≥ 6).

