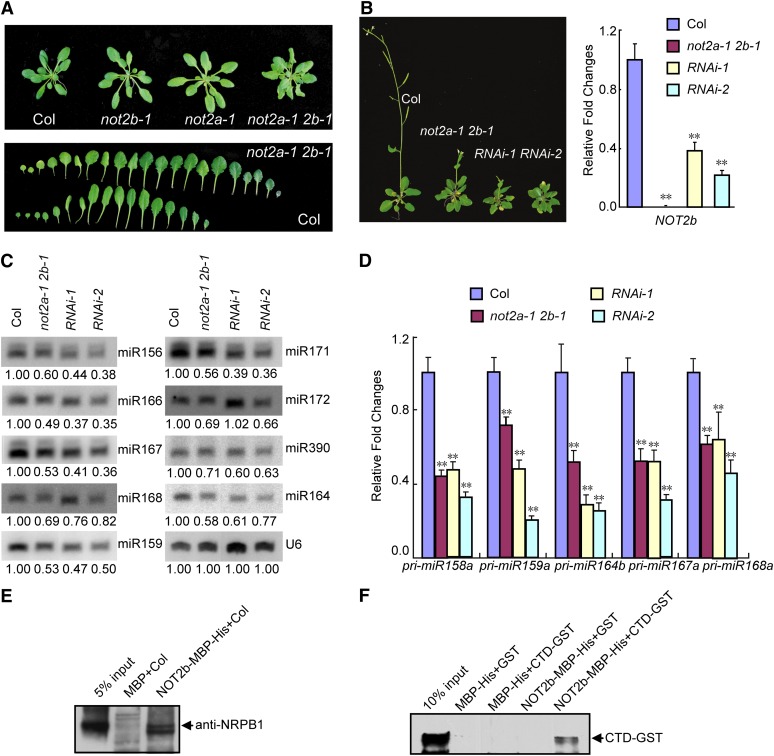
Figure 3.
MiRNA Biogenesis Is Compromised in Weak not2 Mutants.
(A) Phenotypes of 5-week-old plants (top panel) and rosette leaves arranged (from left to right) on the developmental axis (bottom panel) in the wild type (Col) and the weak not2a-1 not2b-1 double mutant (not2a-1 2b-1).
(B) Phenotypes of transgenic lines with RNAi knockdown of NOT2b in the not2a-2 background (left panel). The expression levels of NOT2b, measured by qRT-PCR, in the indicated samples are displayed in the right panel. The transcript levels are presented as the ratio of the value relative to that of the wild type (Col). Error bars represent sd. Data are given as means and sd of at least three independent biological replicates. **P < 0.01 by Student’s t test.
(C) The accumulation of various miRNAs as detected by RNA hybridization in Col, the not2a-1 not2b-1 mutant (not2a-1 2b-1), and two RNAi lines of NOT2b in the not2a-2 background. U6 serves as a loading control. The numbers below each lane represent the intensity ratio of each signal relative to the wild type (Col).
(D) qRT-PCR analysis of pri-miRNA levels at five MIR gene loci in indicated samples. The relative fold changes were normalized to ACTIN. Data are given as means sd of at least three independent biological replicates. **P < 0.01 by Student’s t test.
(E) NOT2b coprecipitated with Pol II by pull-down assays in vitro. Twelve-day-old seedlings of wild-type crude protein extract were used as prey. Pol II was analyzed by immunoblotting using antibodies against the RNA Pol II largest subunit, NRPB1.
(F) In vitro pull-down assays between MBP-His–tagged full-length NOT2b and GST-tagged C-terminal domain (CTD) of NRPB1. The GST-tagged CTD was detected by anti-GST antibody.
[See online article for color version of this figure.]

