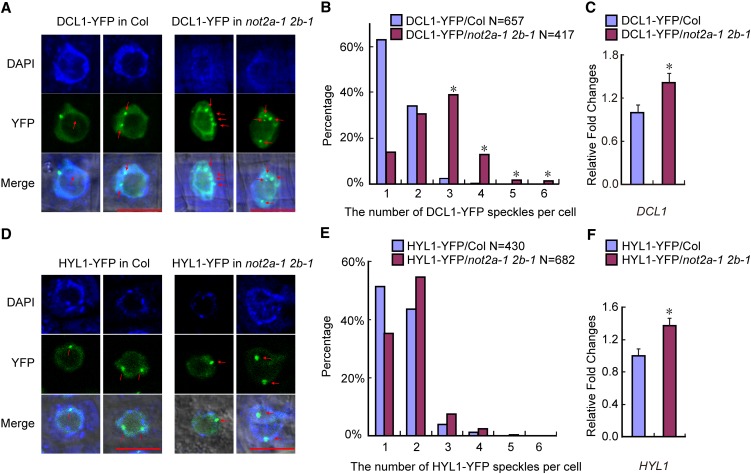
Figure 5.
Localization of DCL1-YFP, but Not HYL1-YFP, Was Affected in not2a-1 not2b-1.
(A) Representative confocal images of transgenic DCL1-YFP fluorescence in the wild type (Col) and not2a-1 not2b-1 (not2a-1 2b-1). Root cells from the meristematic zone were analyzed. Red arrows indicate the DCL1 bodies. Bars = 10 µm.
(B) The percentage distribution of DCL1-YFP speckle numbers per cell in the wild type (Col) and not2a-1 not2b-1 (not2a-1 2b-1). The x axis represents the number of DCL1-YFP speckles per cell, and the y axis represents the percentage of cells with the corresponding DCL1-YFP speckle numbers. “N” represents the numbers of analyzed root cells. *P < 0.05, which was calculated by Wilcoxon-Matt-Whitney test.
(C) qRT-PCR analysis of DCL1 expression level in DCL1-YFP transgenic plants. Data are given as means and sd of at least three independent biological replicates. *P < 0.05 by Student’s t test.
(D) Representative confocal images of transgenic HYL1-YFP fluorescence in the wild type (Col) and not2a-1 not2b-1 (not2a-1 2b-1). Root cells from the meristematic zone were analyzed. Red arrows indicate the HYL1 bodies. Bars = 10 µm.
(E) The percentage distribution of HYL1-YFP speckle numbers per cell in the wild type (Col) and not2a-1 not2b-1 (not2a-1 2b-1). The x axis represents the number of HYL1-YFP speckles per cell, and the y axis represents the percentage of cells with the corresponding HYL1-YFP speckle numbers. “N” represents the numbers of analyzed root cells.
(F) qRT-PCR analysis of HYL1 expression in HYL1-YFP transgenic plants. Data are given as means sd of at least three independent biological replicates. *P < 0.05 by Student’s t test.

