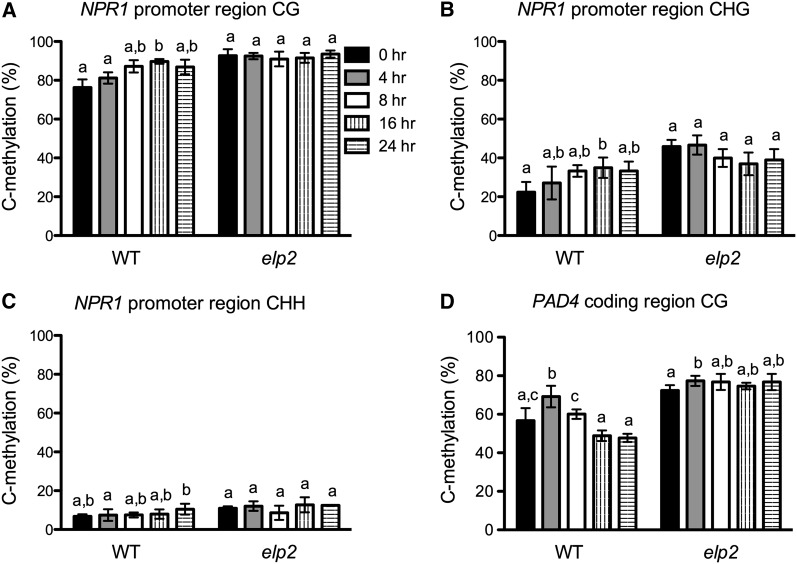
Figure 6.
Pathogen-Induced Dynamic DNA Methylation Changes in NPR1 and PAD4.
(A) to (C) Average methylation levels of methylcytosines at CG sites (A), CHG sites (B), and CHH sites (C) of the NPR1 promoter region in elp2 and the wild type (WT).
(D) Average methylation levels of methylcytosines at CG sites of the PAD4 coding region in elp2 and the wild type.
DNA samples were extracted from three biological replicates of each genotype/time point. After bisulfite conversion and PCR amplification, the PCR products were cloned into pGEM-T easy vector. A total of 45 independent clones were sequenced for each genotype/time point (15 for each DNA sample). The 15 clones from the same DNA sample were used to calculate methylation levels, which were then used for statistical analysis. Data represent the mean of three independent samples with sd. Different letters above the bars indicate significant differences (P < 0.05, t test). Note that the comparison was made separately among time points for each genotype.

