
Figure 5. T-bet localization in resting CD8 T-cell memory populations.
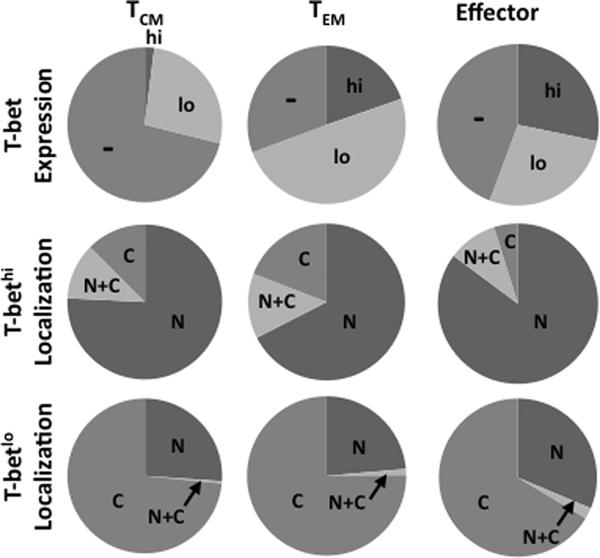
Graphical representation of the average percentage of cells expressing T-bethi or T-betlo in central memory (TCM), effector memory (TEM), or effector cells is shown (top row). The localization of T-bet in T-bethi (middle row) or T-betlo (bottom row) within each memory population is shown. N = exclusively nuclear; N+C = nuclear and cytoplasmic; C = exclusively cytoplasmic. Pie charts represent average responses of 3 normal donors.