
Figure 8. Activation-induced changes of Eomes expression and localization in CD8 T-cell memory populations.
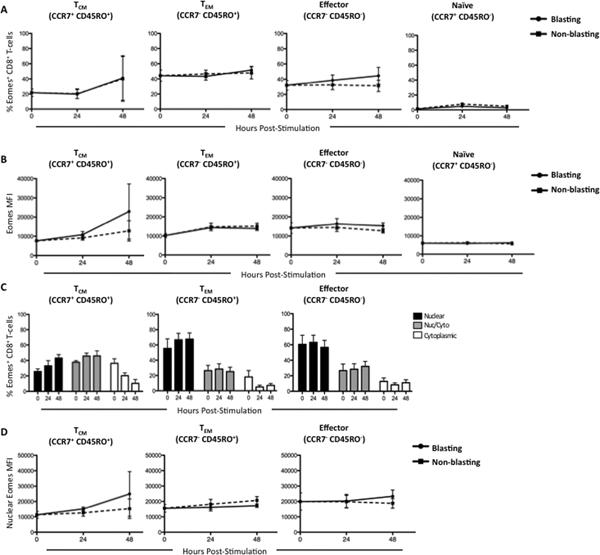
CD8+ T-cells from three normal human donors were sorted into memory populations as follows: naïve (CD45RO−CCR7+), central memory (TCM, CD45RO+CCR7+), effector memory (TEM, CD45RO+CCR7−), and effector (CD45RO−CCR7−) and stimulated with αCD3, αCD28, and αCD49d for 72 hours. At 24-hour intervals, cells were collected and data analyzed using IDEAS software. Blasting (solid line) vs. non-blasting (dashed line) cells were delineated based on size. (A) Longitudinal assessment of the average percentage of Eomes+ cells (B) and the median fluorescence intensity within each CD8+ memory population is plotted. (C) Changes in the percentage of cells expressing exclusively nuclear (black bars), nuclear and cytoplasmic (grey bars), and exclusively cytoplasmic (white bars) Eomes is plotted for central memory, effector memory, and effector CD8+ T-cells. (D) Longitudinal analysis of Eomes MFI within the nucleus of central memory, effector memory, and effector CD8+ T-cells is plotted. Statistically significant differences are delineated by *. * p<0.05, ** p<0.001, *** p<0.0001.