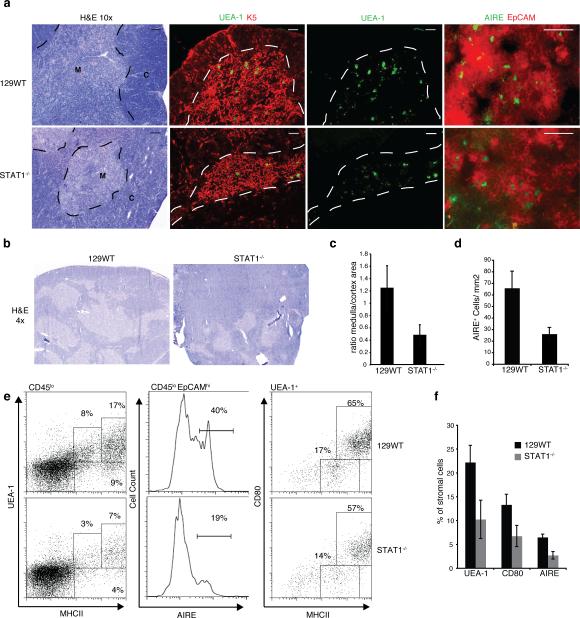
Figure 1. Impaired medullary thymic architecture in IFNAR-/- and STAT1-/- mice.
a) Thymic architecture in WT129 and STAT1-/- mice as revealed by H&E staining of thymic sections (left panels); Keratin 5 (red) and UEA-1 (green) staining (middle panels), bar = 100μm; EpCAM (red) and AIRE (green) staining (right panels), bar = 50μm; M, medulla; C, cortex. b) Low magnification (4x) of H&E stains. c) Ratio of medullary to cortical cellularity in thymic sections from WT and STAT1-/- mice (data collected using ImageJ (NIH) and represent avg +/-SD of 3 sections each from 3 mice (p<0.05). d) AIRE+ cells per unit area (quantified from thymus sections shown in Fig.1a, lower panels) e) mTEC populations in WT and STAT1-/- thymi as determined by flow cytometric expression analysis of MHCII and UEA-1 (left), as well as AIRE and EpCAM (middle) on CD45lo stromal cells; MHCII and CD80 expression on UEA-1hi gated stromal cells. f) mTEC populations in WT and STAT1-/- thymi (n=4) using the indicated markers.

