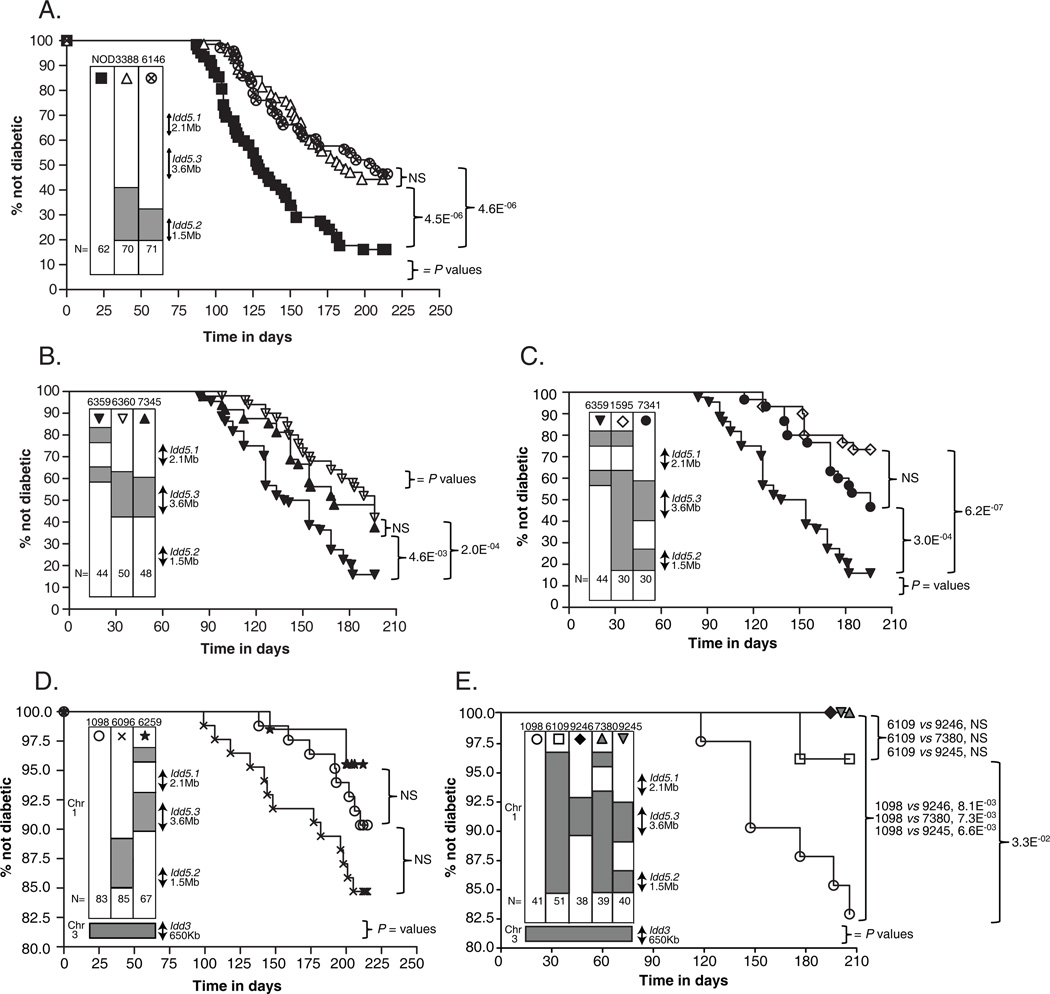
Figure 2.
Diabetes frequencies of the novel congenic strains developed specifically for this study. The diabetes frequency studies represented in Figures 2A and 2D were performed at Merck Research Laboratories whilst the studies in Figures 2B, 2C, and 2E were conducted at Taconic. Group size N is indicated at the bottom of the genetic map of each strain. The p-values were calculated by comparing the Kaplan-Meier survival curves of the indicated strains using the log-rank test. NS, not significant, p-value ≥0.05. (A) Diabetes frequencies of the Idd5.2 congenic Lines 3388 and 6146 females were compared with NOD females. (B) Diabetes frequencies of the Idd5.3 congenic Lines 6360 and 7345 females were compared with NOD females. (C) Diabetes frequencies of the Idd5.2+5.3 congenic Lines 1595 and 7341 females were compared with NOD-like Line 6359 females. (D) Diabetes frequencies of the Idd3 congenic Line 1098, the Idd3+5.2 congenic Line 6096, and the Idd3+5.3 congenic Line 6259 females were compared. Note that the y-axis is truncated due to the low frequency of T1D in the strains examined. (E) Diabetes frequencies of the Idd3 congenic Line 1098, the Idd3+5.3 congenic Line 9246, two Idd3+5.2+5.3 congenic Lines 7380 and 9245, the Idd3/5 congenic Line 6109 females were compared. Note that the y-axis is truncated due to the low frequency of T1D in the strains examined.

