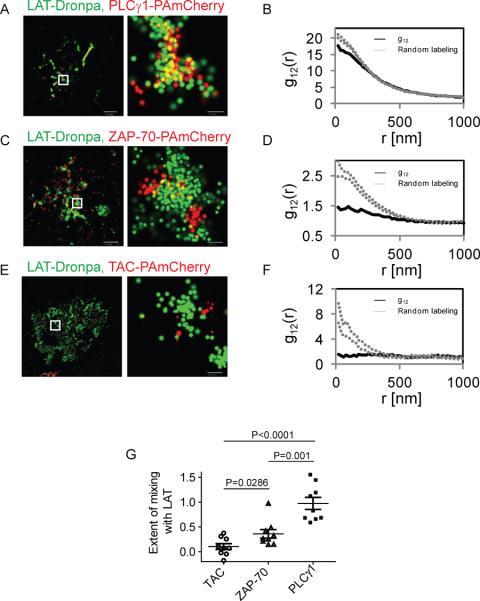
Figure 2. Studying protein-protein interactions by two color PALM and bivariate PCF statistics.
(A) Two color-PALM image of a Jurkat E6.1 cell on a TCR stimulating coverslip. The cell expressed LAT-Dronpa and PLC-γ-PAmCherry. (B) Bivariate pair-correlation function (PCF) of the identified molecules within a study region of the cell. (C) Two color-PALM image of a Jurkat E6.1 cell on a TCR stimulating coverslip. The cell expressed LATDronpa and ZAP-70-PAmCherry. (D) Bivariate PCF of the identified molecules within a study region of the cell. (E) Two color-PALM image of a Jurkat E6.1 cell on a TCR stimulating coverslip. The cell expressed LAT-Dronpa and TAC-PAmCherry. (F) Bivariate PCF of the identified molecules within a study region of the cell. (G) The extent of mixing between LAT and TAC, ZAP-70 and PLC-γ1 in multiple cells (n=9). Bars - 2 μm for whole cell images and 200nm for zoomed images.

