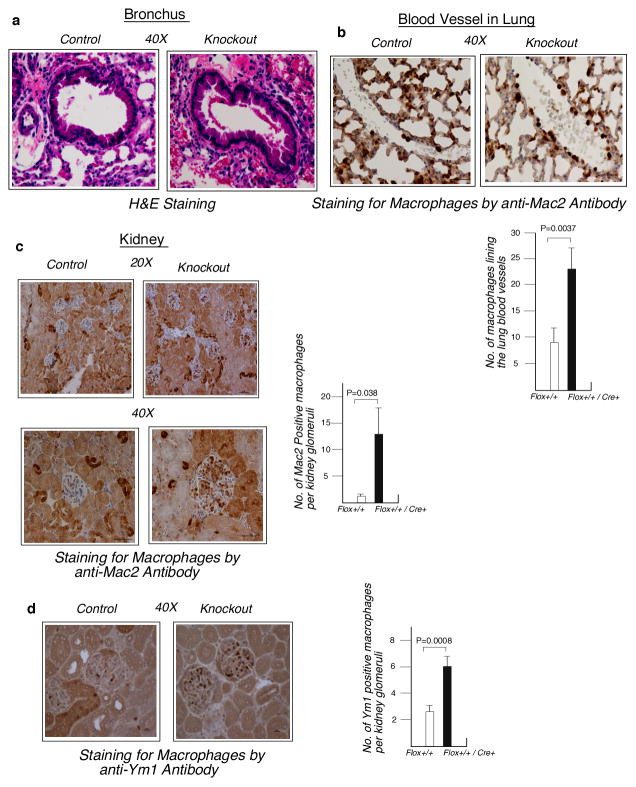
Figure 6. Widespread infiltrates of immune cells in the major organs of the KO mice upon 24 hr of post-LPS challenge.
a, H&E staining of the bronchus and adjacent alveoli of lung. Slide prepared from formalin fixed lung tissue and methanol fixed tissue was used for Ym1 staining. Image taken at 40X magnification in 10 μ scale. In control mouse RBCs are largely intravascular with more open alveolar spaces. In the KO mouse the alveolar spaces are filled by RBCs, a sign of hemorrhage. b, Upper panel, Adhesion of macrophages in the blood vessel of lung. Formalin fixed lung sections were stained for macrophages using anti-Mac2 antibody. In the control mouse fewer Mac2 positive macrophages line the blood vessel whereas in the KO animal increased numbers of macrophages adhere to the blood vessel. Lower panel, Quantifications of the results shown above. Results are mean ± s.d, n=5, paired two-tailed Student’s t-test. P value is on the top of the figure. c and d, Infiltration of macrophages in the renal glomeruli. Kidney sections were stained with anti-Mac2 antibody (c) and anti-Ym1 antibody (d). Increased presence of Mac2 and Ym1 positive macrophages were observed in the glomeruli of KO mice. For Mac2 positive macrophages image taken at 20X (upper panel) and 40X (lower panel) magnification of two different fields of the same slides with 10 μ scale. For Ym1 positive macrophages image taken at 40X magnification with 10 μ scale. Quantification of the Mac2 and Ym1 positive macrophages per glomerulus is shown in the right panels. Results are mean ± s.d, n=5 per group, 70 glomeruli per animal were counted, paired two-tailed Student’s t-test. P value is on the top of the figure. The results shown in figures a to d are from one representative mouse in each group, similar results were found in all 5 mice per group.

