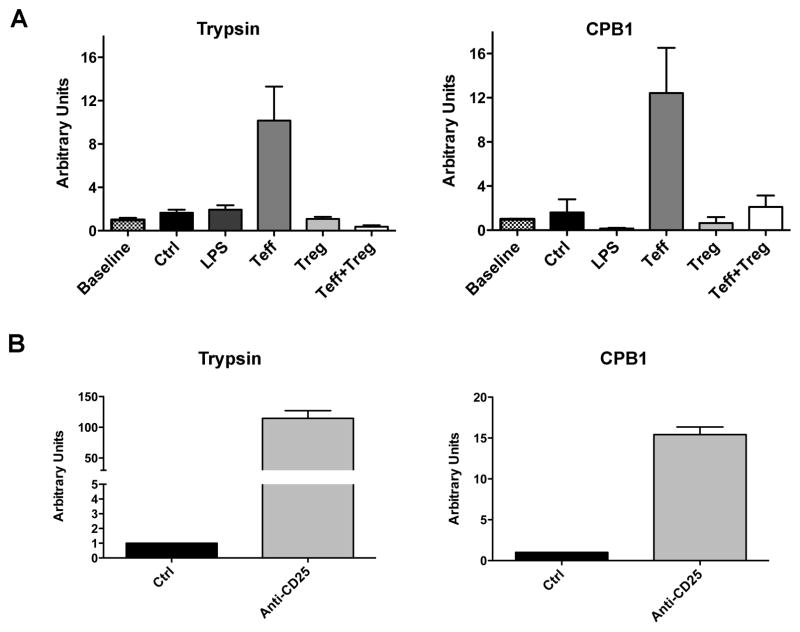
Figure 5. Interactions between DC and CD4 T cells regulate expression levels of pancreatic enzymes in DC.
(A) DC were cultured alone (ctrl), with LPS, or with polyclonally activated CD25-CD4+ T cells (Teff) and/or CD25+CD4+ T cells (Treg). After 24h of co-culture DC were separated and mRNA was extracted for qRT-PCR analysis. Units were standardized against levels pre-culture (baseline). Bars represent mean ± SEM. Data are representative of two independent experiments. (B) MUC1.Tg mice were treated with an antibody against CD25 to deplete regulatory CD4 T cells (Anti-CD25) or with an isotype control (ctrl). 2 days following depletion, mice were vaccinated with soluble MUC1p plus Poly-ICLC i.v. Splenic RNA was extracted 24h post vaccination for qRT-PCR analysis. Units were standardized against isotype control treated mice. Bars represent mean ± SEM respectively. Data are representative of 3 independent experiments.

