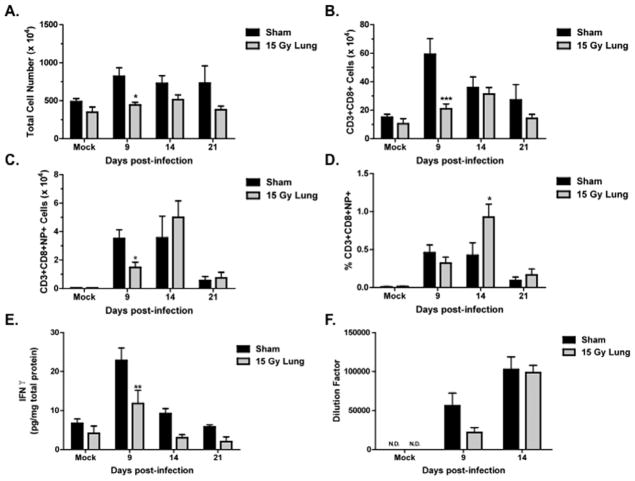
Figure 3. Adaptive responses to influenza a virus in sham and 15 Gy whole lung irradiated mice.
(A) Total cell number isolated from the lung. (B) CD8+ T cell number in the lung, identified by CD3+ and CD8+ staining. (C) Virus-specific CD8+ T cell counts, identified by positive staining for CD3, CD8 and the T cell receptor recognizing the Db/NP366–374 epitope (NP+). (D) Percentage of virus-specific CD8+ T cells. (E) IFNγ protein concentration in the lung. (F) Virus-specific IgG antibody levels in plasma. (***p<0.001*p<0.05 versus sham-infected; n=4–6)

