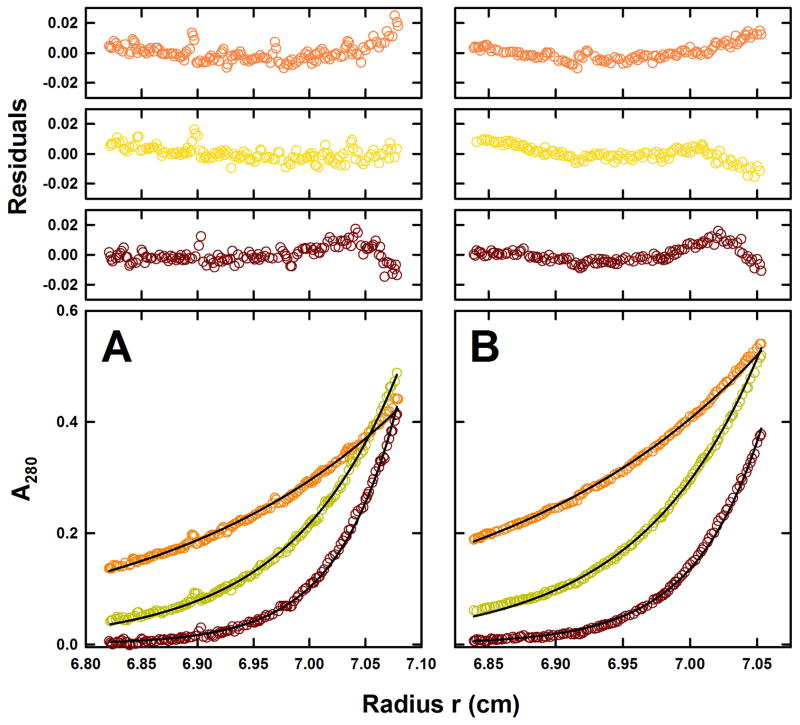
Figure 3.2.
Sedimentation equilibrium studies of empty-nanodiscs. SE profiles for (A) H7-MSP1D1/POPC and (B) H7-MSP1D1/POPG empty-nanodiscs at 10.0°C plotted as a distribution of the absorbance at 280 nm versus radius at equilibrium. Data were collected at 10 (orange), 15 (yellow) and 20 (brown) krpm and loading concentrations of (A) 5.8 and (B) 8.2 μM. The solid lines show the best-fit analysis in terms of a single non-interacting species, returning a buoyant molar mass consistent with the presence of single nanodiscs. The corresponding residuals for this best-fit are show in the plots above.

