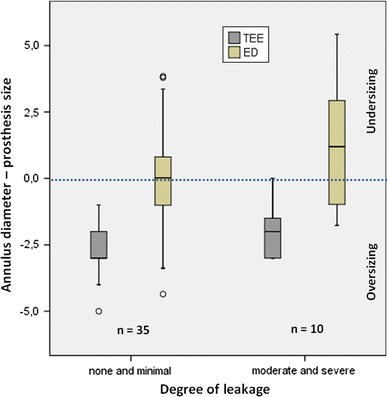
Fig. 5.

Prosthesis oversizing and rate of paravalvular leaks. This graph shows the degree of prosthesis oversizing derived from TEE (grey boxplot) and CT-based effective diameter (ED, green boxplot), grouped by the degree of paravalvular leakage after TAVI. Values below the blue neutral line indicate a prosthesis oversizing (in mm), while values above this line indicate a prosthesis size smaller than the aortic annulus
