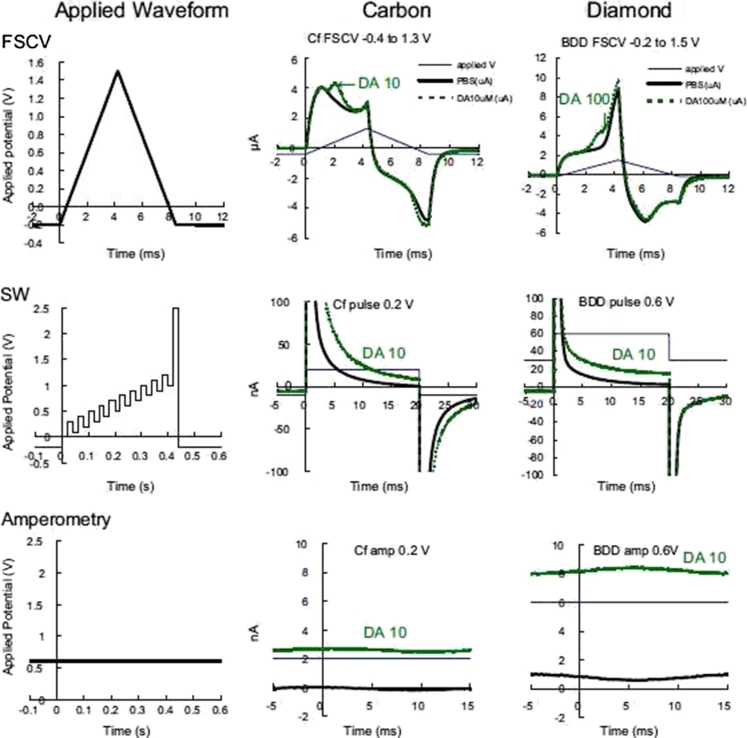
Fig. 3.
Applied waveforms and current recordings for fast-scan cyclic voltammetry (FSCV; top row), square-wave differential pulse voltammetry (SW; middle row), and constant-potential amperometry (bottom row). The left column shows the potential applied to the Ag/AgCl reference electrode. The middle column shows the actual current measured for each waveform at the carbon fiber. For square-wave, only one pulse is indicated. The right column shows the current measured at the diamond microelectrode. Typical recorded currents in PBS (black) and in high (10 and 100 nmol L−1) concentrations of dopamine (green). (Adapted, with permission, from Ref. [133])

