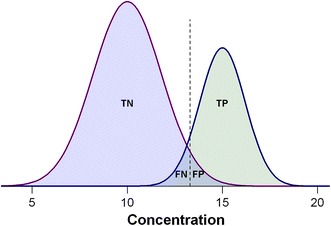
Fig. 2.

Illustration of TP, TN, FP, and FN with hypothetical biomarker test data. The distributions of true outcomes are given by the two Gaussian curves with positive cases on the right side and negative cases on the left. The cut-off level is indicated by the dashed line. Due to the overlap between the biomarker concentrations of the two populations, the cut-off level will misclassify the left-hand side of the positive cases and the right-hand side of the negative cases. TP true positives, TN true negatives, FP false positives, FN false negatives
