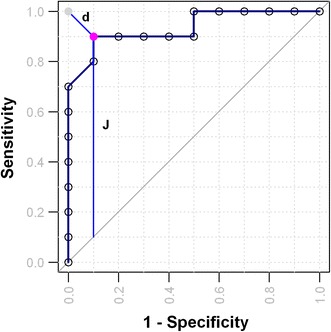
Fig. 3.

Empirical ROC curve and optimal cut-off. After obtaining a list of sensitivity and specificity values from all possible cut-offs, one should plot all pairs of sensitivity and 1-specificity values as empty circles, and then connect each neighboring circles with line segments to generate empirical ROC curves. The optimal cut-off (solid circle in magenta) can be identified as the point with by minimal d the distance from a cut-off to the solid grey circle (0, 1), or the point with maximal vertical distance from the diagonal line, also known as the Youden index J (Color figure online)
