
Fig. 6.
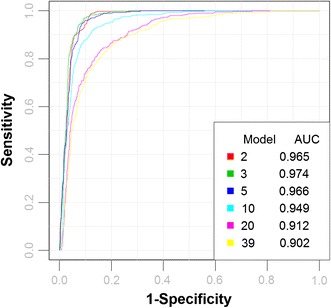
Comparison of different models based on ROC curves. Six biomarker models were created using a linear SVM with different numbers of features. ROC curves were generated using the predicted class probabilities from repeated cross validation for each model. The legend shows the feature numbers and the AUCs of the six models