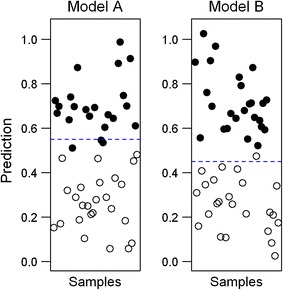
Fig. 7.

Difference between ranking and classification. The two scatter plots show the predicted class probabilities for 50 new samples by two biomarker models. Both models are able to rank all new samples correctly. Therefore, they both will have the same AUC (1.0) but exhibit different error rates (3/50 and 1/50 respectively) due to their different decision boundaries, which were determined during the model creation process
