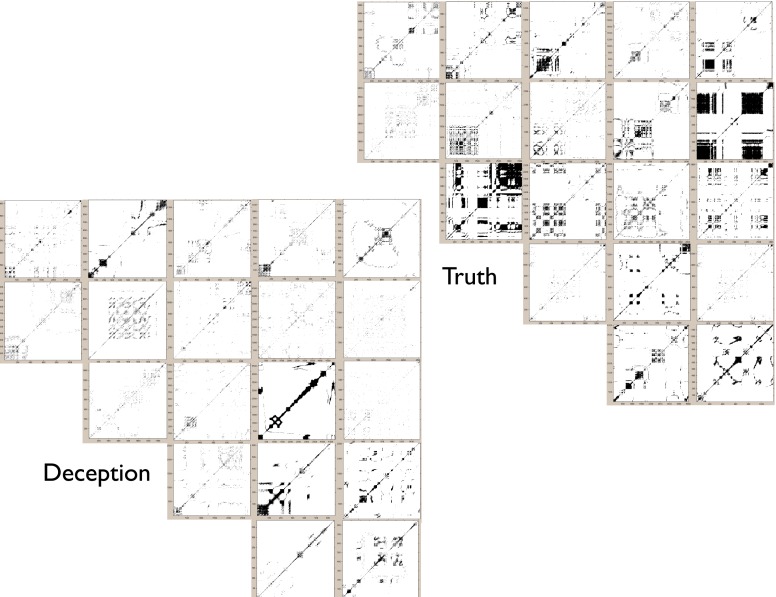
Figure 7.
For upper face movements, mosaic of recurrence plots for randomly selected subset of deceptive and truthful responses for critical questions. Deception is shown in the lower panel and truth in the upper panel. For truth, there is overall higher determinism than deception, as indicated by the greater percentage of recurrent diagonal lines. Each plot shown in this array is a reflection of the “recurrences” of face movements over time; the more points there are, the more the time series of movements exhibits similar fluctuations. Glancing at the plots does reveal that Truth plots seems to have more dense appearance of recurrence structures (for details on method, see Figure 1). This is quantified using the Determinism percentage shown in Figure 8.

