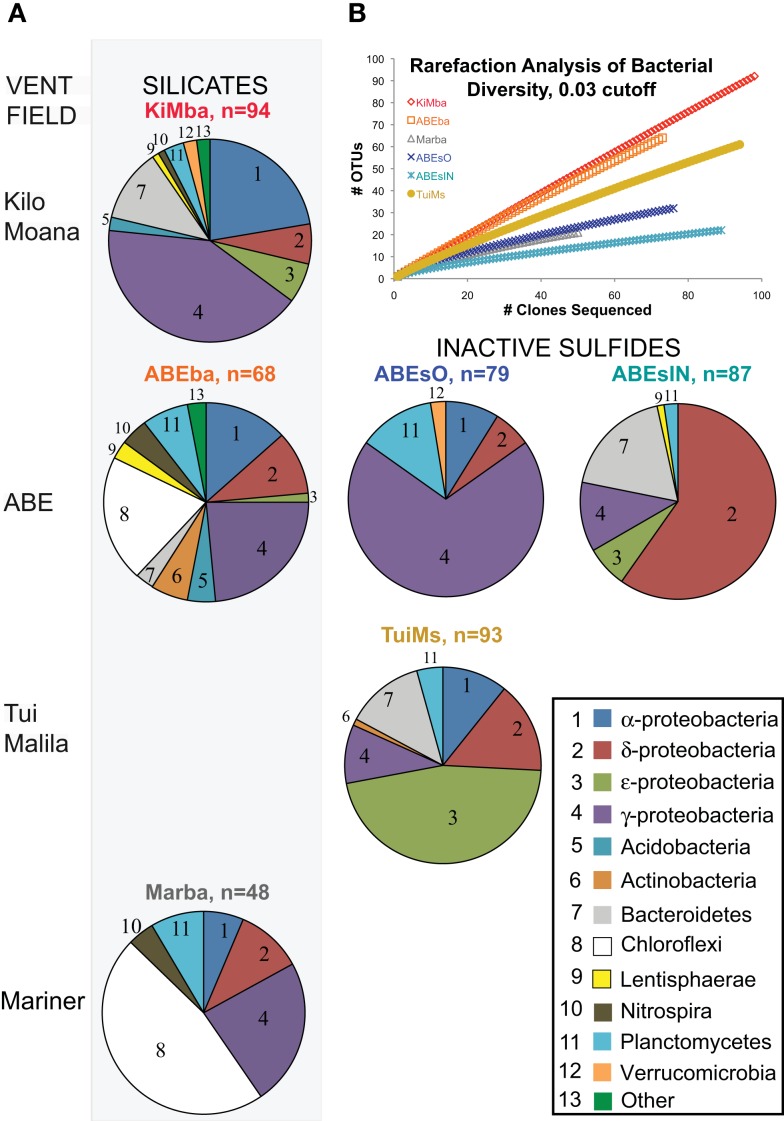
Figure 4.
(A) Bacterial distributions recovered from samples in this study. Samples are arranged in rows from north to south in Lau Basin and the silicate samples are in the left column of pie charts while the inactive sulfides are to the left. The number of clones recovered per sample is indicated next to the sample name. Bacterial phyla/class are indicated by the numbers in each pie slice, according to the key at bottom right. (B) Rarefaction analysis of clone libraries from this study. Clones were aligned, pre-clustered (Huse et al., 2010), and analyzed at the 97% similarity level using the average neighbor method in the software mothur (Schloss et al., 2009).

