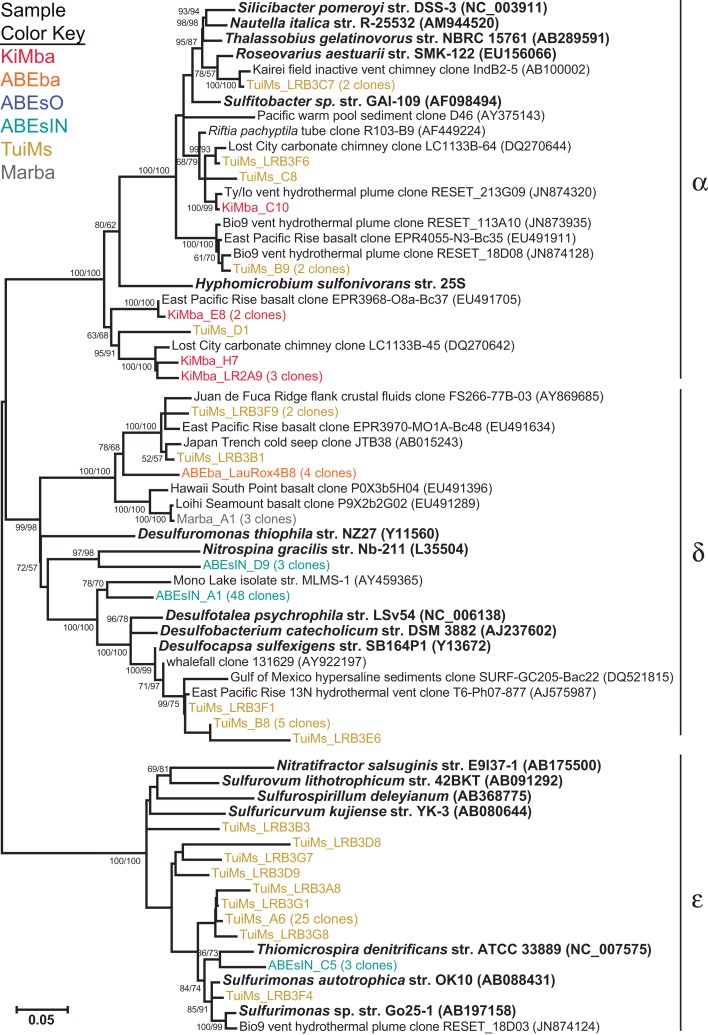
Figure 6.
Phylogenetic tree of representative clones from this study that fall within the α-, δ-, and ε-proteobacteria. Clones with more than one representative, or for which multiple members fell into a single clade, were chosen. Numbers in parentheses after some clones indicate total number of clones represented by the single clone depicted. The tree was generated in MEGA 5 using the maximum likelihood method with the Jukes–Cantor model and a Gamma distribution and 1000 bootstrap replicates. The same alignment was used to generate a neighbor-joining tree with the maximum composite likelihood method and 1000 bootstrap replicates. Nodes where both methods agree and bootstrap support was >50% are indicated with bootstrap values from the neighbor-joining tree on the left and the maximum likelihood tree on the right. Samples are color-coded and no representative clones are shared across multiple samples.

