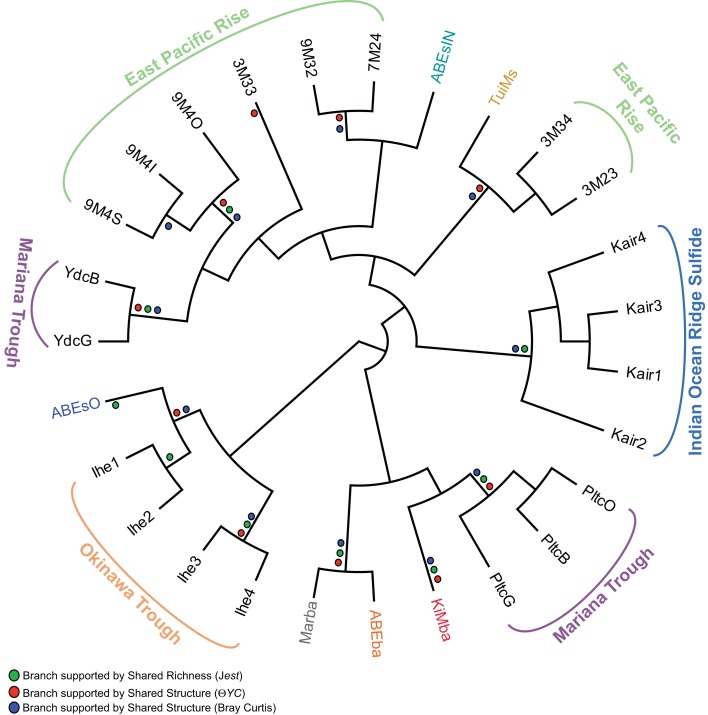
Figure 8.
Cladogram of OTU-based comparison of bacterial communities sampled from inactive sulfides in this and prior studies using the Jclass algorithm. The three silicate samples from this study are included. Where the Jclass analysis agreed with community comparison using Jest, ΘYC, and/or Bray–Curtis algorithms, a dot for the agreeing methods is placed at the node in the cladogram. Overall agreement is strong between all four methods save for sample 3M33 from the EPR. Sampling location is indicated for samples from prior studies: EPR (Sylvan et al., 2012a), Mariana Trough (Kato et al., 2010), and the Indian Ocean Ridge and Okinawa Trough (Suzuki et al., 2004). Sample color code for samples from this study is the same as in Figures 4–7.

