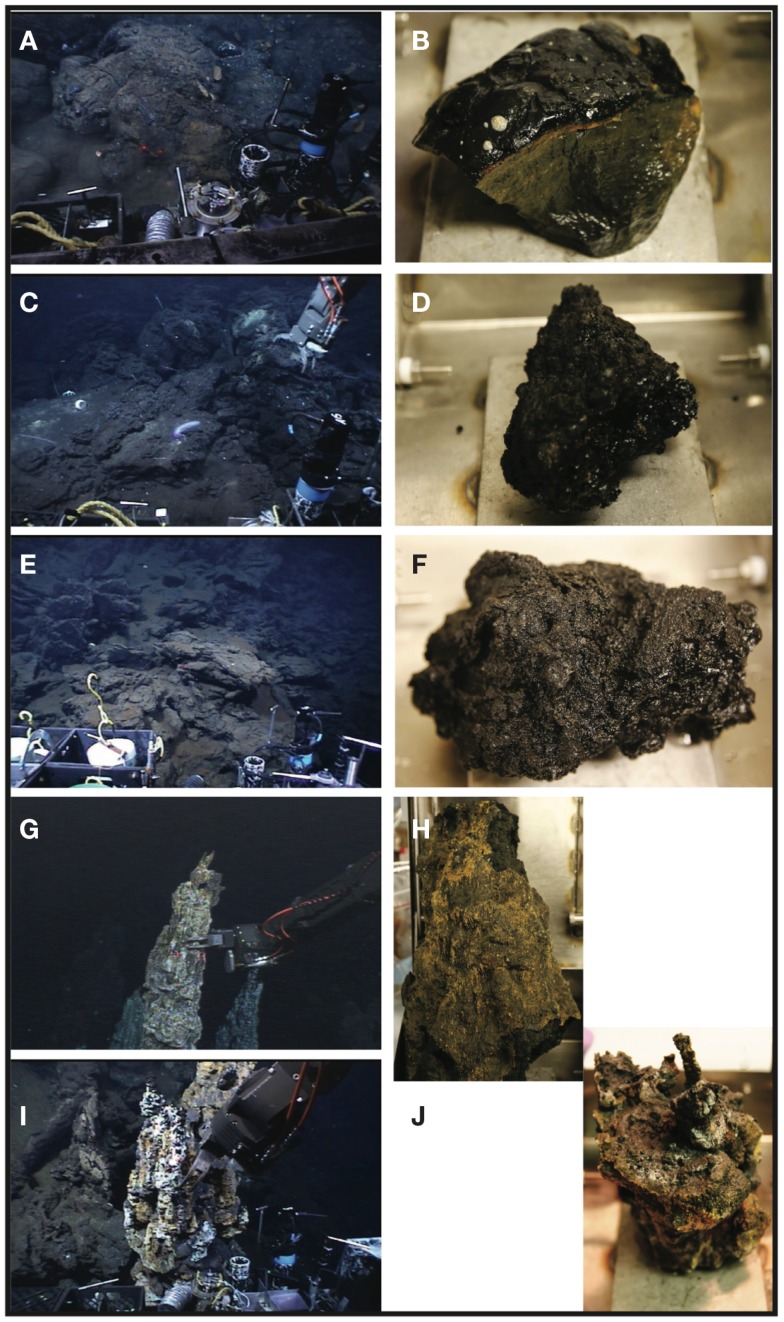
Figure A1.
Seafloor and shipboard photographs of samples collected during this study. Sample KiMba as it appeared on the seafloor (A) and in the sampling box (B). Sample ABEba on the seafloor (C) and onboard (D). Sample Marba as it appeared on the seafloor (E) and on the ship (F). Sample ABEs as it was collected by ROV Jason II (G) and on the ship (H). Sample TuiMs, photographed during collection (I) and on the ship (J).

