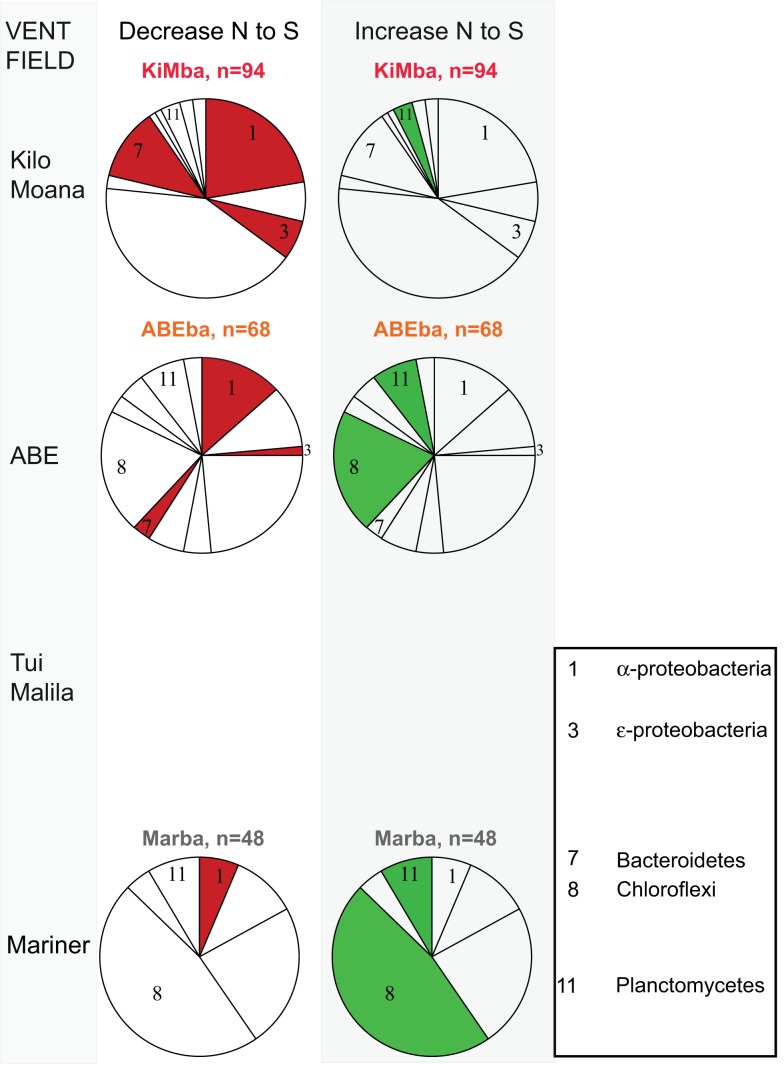
Figure A2.
Bacterial distributions of phyla/classes that either decrease (left column) or increase (right column) in proportionality from north (Kilo Moana) to south (Mariner) on silicate samples in this study. Key is the same as Figure 4, except that phyla/classes that decrease from north to south are all red, those that increase from north to south are all green, and those that do not show a north to south pattern are not included.

