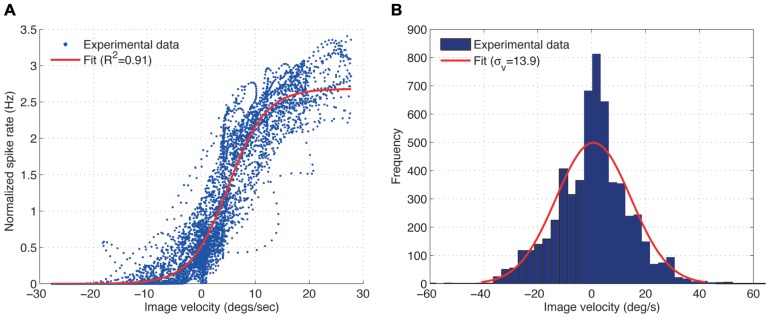
FIGURE 2.
(A) Experimental measurement showing the input–output relationship for the H1-cell under closed-loop conditions (blue) and its least-squares sigmoid fit (A = 2.68, β = 0.29) (red), obtained from the fly robot response with the static gain controller (Kp = 0.1) and sinusoidal input (fi = 0.03 Hz). For further explanation see text. (B) Distribution of the image velocities observed in closed-loop is approximately Gaussian.

