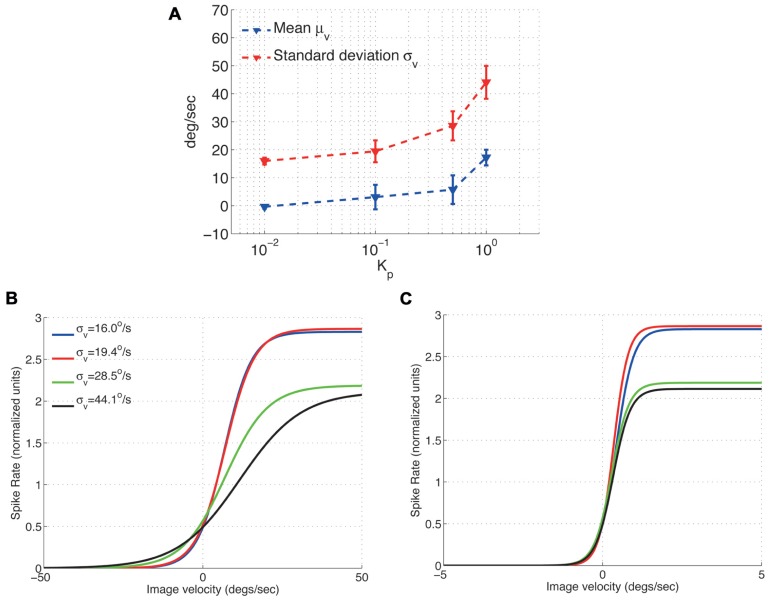
FIGURE 3.
Effect of the image velocity mean and standard deviation on the adaptive scaling properties of the H1-cell response function (A) Mean and standard deviation of the H1 input (slip speed). (B) The fitted H1-cell response functions adapts to accommodate the increased standard deviation of the image velocities (C) Normalizing the image velocities in (B) by their corresponding standard deviations results in response functions with similar slopes (around σv = 0 deg/s). The respective peak spike rates (normalized), however, remain unchanged.

