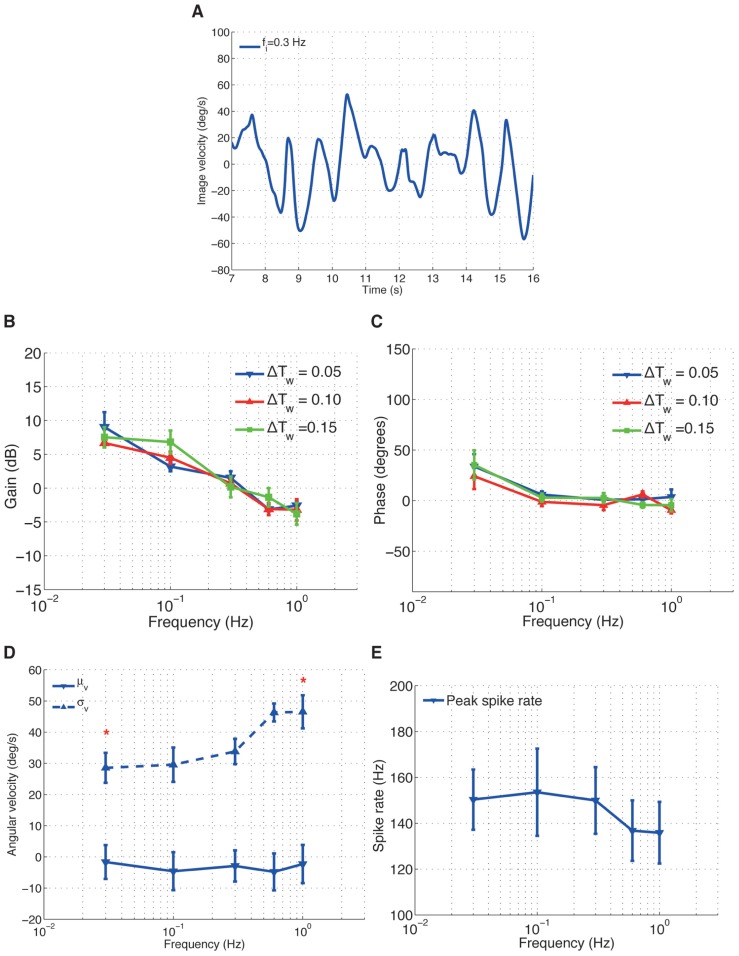
FIGURE 4.
H1-cell frequency response. (A) An example time course data of image velocity observed by the fly for an input frequency fi = 0.3 Hz. The gain (B) and phase (C) plots over different input frequencies. (D) The mean (μv) and standard deviation (σv) of the image velocities. *Values of σv for fi = 0.3 Hz and fi = 1.0 Hz are significantly different (calculated using Wilcoxon rank-sum method with α = 0.001). (E) Peak spike rate (*) for different input frequencies.

