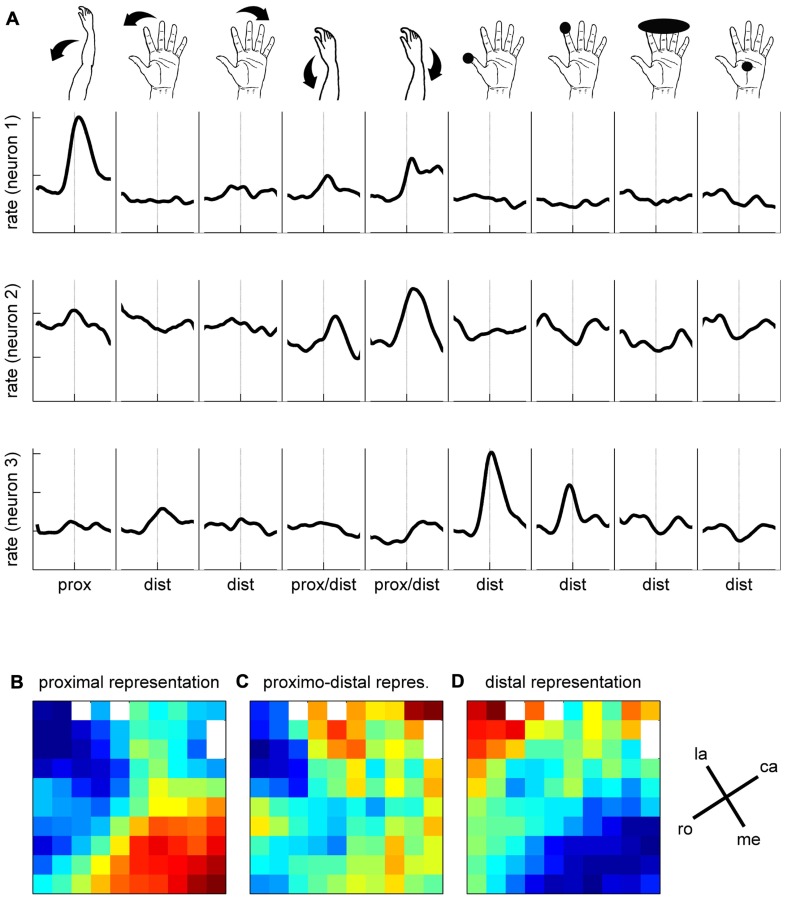
FIGURE 9.
Somatosensory properties of spiking activity. (A) Responses of three simultaneously recorded neurons to nine stimulus conditions, as indicated by the drawings above. Mean firing rates are indicated in z-score, averaged across ~30 trials. For each stimulation condition, the mean firing rate is presented ±400 ms around the trigger signal (dashed lines). (B–D) Maps of somatosensory properties. Color code indicates min (blue) to max (red) activation, averaged across all neurons recorded during 3 days on each electrode of the array. White squares correspond to the inactive electrodes of the array. la, lateral; me, medial; ro, rostral; ca, caudal; see Figure 1C.

