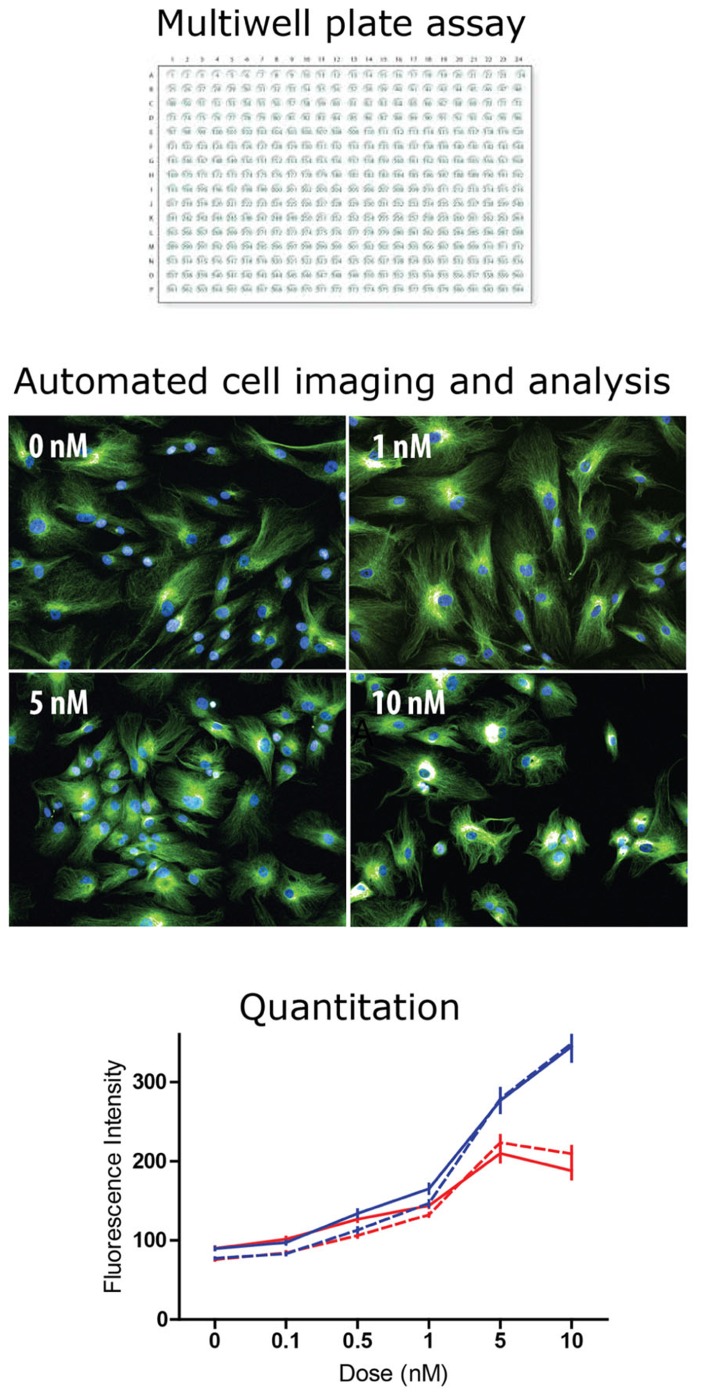
FIGURE 2.
High content screening: industrial scale microscopy. High content screening is the automated microscopic analysis of fluorescence in cells of a multiwell plate. Most high throughput screening assays read activity per well (e.g., fluorescence, absorbance, and luminescence). In high content screening fluorescence in individual cells is quantified with automated image analysis. Typically, algorithms find the cells in the image and then measure fluorescence intensity and spatial distribution. The example shows tubulin fluorescence in cells (green) and cell nuclei (blue) at different concentrations of taxol, a tubulin-binding drug. The drug effect is difficult to see by eye but the analysis algorithm identifies each cell and quantifies tubulin fluorescence intensity, plotted here as a dose–response curve to two drugs, taxol (blue) and vinblastine (red) in two cell types: control-derived ONS cells (solid lines) and HSP patient-derived ONS cells (dashed lines; Abrahamsen et al., 2013). With high content screening thousands of cells can be analyzed to reveal small but significant differences between drugs, doses, and cell types.

