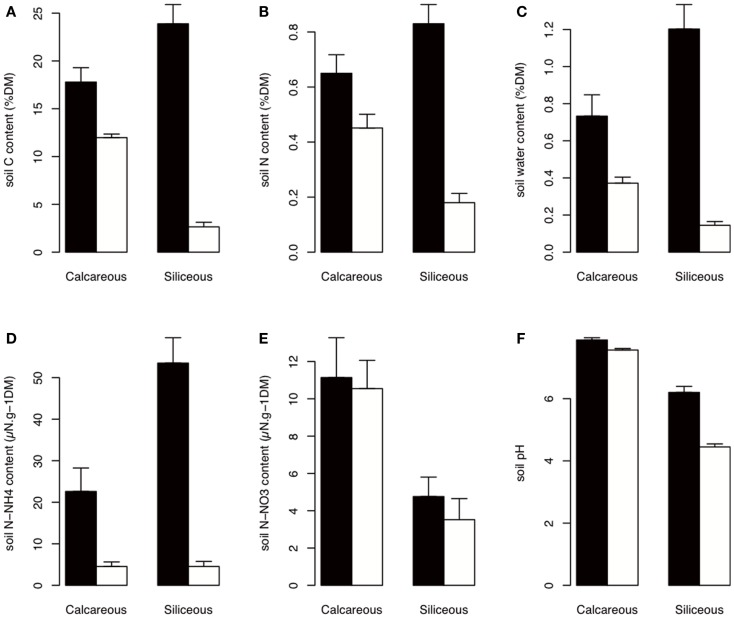
Figure 2.
Soil properties according to habitat and bedrock type. The best AIC models indicated a habitat effect that is dependent on bedrock type (Table A1 in Appendix). Black: In habitat; white: Out habitat. Error bars represent SD. (A–F) are total carbon content, total nitrogen content, soil water content, ammonium content, nitrate content, and soil pH, respectively. DM, dry matter.

