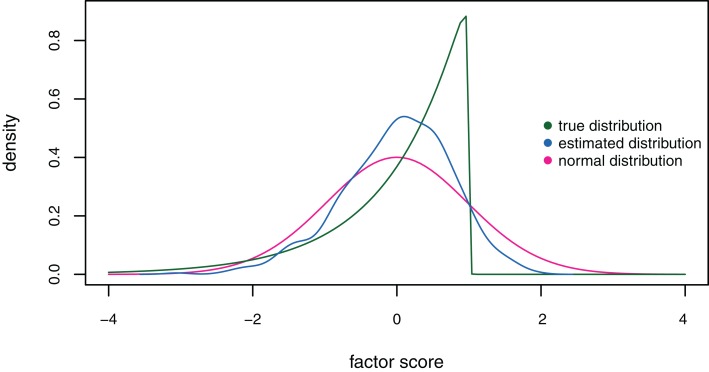
Figure 8.
Distributions of the estimated (blue curve) and true (green curve) factor scores on the fourth factor under the exploratory factor analysis model for sample size n = 1,000, factor space dimension k = 4, and true skewness μ3 = − 2. The unit normal distribution is plotted as a reference (red curve).

