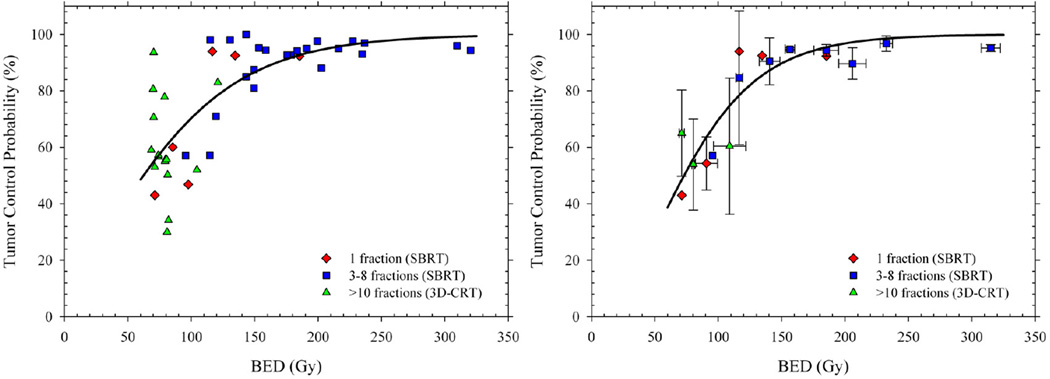
Figure 1.
Tumor control probability (TCP) as a function of biological effective dose (BED) for stage I NSCLC. Left panel shows crude local control rates (≥ 2 years) redrawn from a pooled analysis reported by Mehta et al. (8) with different symbols distinguishing 3D-CRT and SBRT regimens. Right panel shows weighted mean TCP probabilities calculated from the same data to compensate for the different numbers of patients in each study. Solid lines are TCP predictions for an LQ-based fit to the available data.

