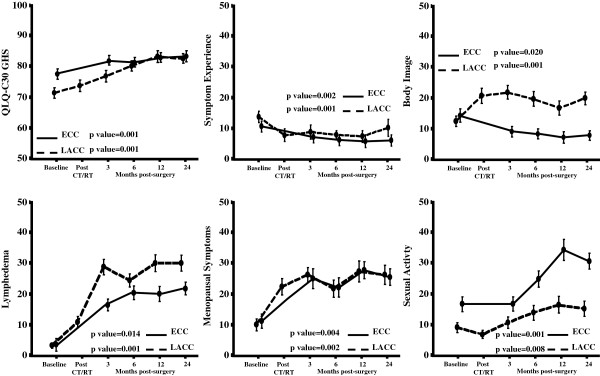
Figure 3.

Plots of the QoL scales/items showing statistically significant variations over time (Error bars indicate standard deviations).

Plots of the QoL scales/items showing statistically significant variations over time (Error bars indicate standard deviations).