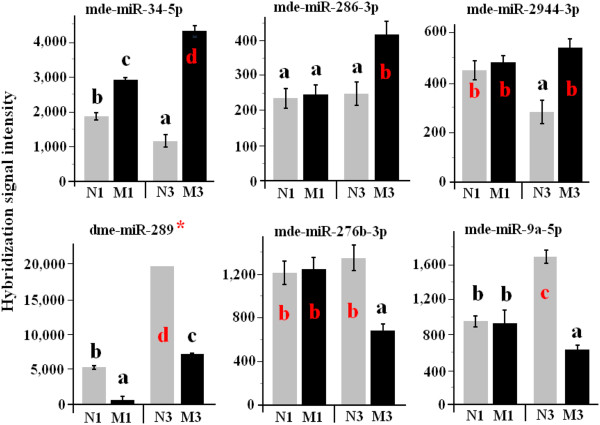
Figure 4.
Abundance of miRNAs affected by host genotypes. miRNA names are given on the top of each graph. N1, M1, N3, and M3 represent one-day larvae feeding in Newton (a susceptible cultivar) seedlings, one-day larvae in Molly (a resistant cultivar) seedlings, three-day larvae in Newton seedlings, and three day larvae in Molly seedlings, respectively. Three biological replicates were conducted for each assay. The error bar in each graph represents standard error (SE). The small letters in each graph indicate different groups based on t-test with P ≤ 0.05. The symbol ‘*’ indicates that the miRNA has not been identified in Hessian fly and the results were based on the ortholog from another insect.

