
Figure 3.
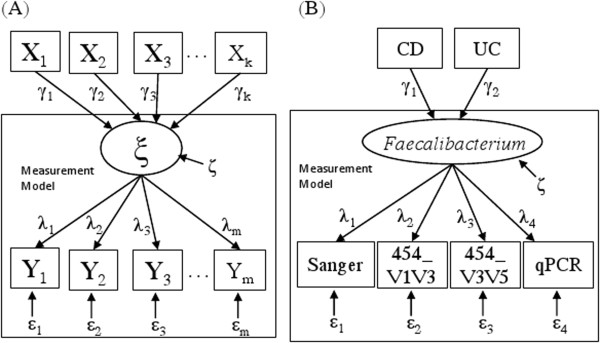
Path diagram for a latent variable SEM with covariates. (A) A general model with m measurements and k covariates for one latent variable ξ. (B) The model with four measurements (Sanger, 454_V1V3, 454_V3V5 and qPCR) and two covariates -- two binary disease indicators: CD (= 1 for subjects with Crohn’s disease, and 0 otherwise), and UC (= 1 for subjects with ulcerative colitis, and 0 otherwise) for the true/latent (logit-transformed) relative frequency of Faecalibacterium.